
Meet HyperTracker: Real-Time Wallet Behavior Tracking on Hyperliquid
By CMM Team - 06-Aug-2025
What is HyperTracker?
HyperTracker is a live analytics tool built on top of the Hyperliquid blockchain. At its core, it’s a window into how every wallet on Hyperliquid is trading — updated continuously, segmented into meaningful cohorts, and surfaced through an intuitive interface designed for traders.
To make this possible, we’ve deployed a read-only node directly on Hyperliquid. This lets us ingest and parse the entire public state of the chain in real time, with full visibility into every wallet’s current positions, exposure, and historical performance.
Because Hyperliquid is a fully on-chain perp DEX, it unlocks a unique opportunity: we can now produce live, global insights across every perp trader with an open position — something that’s never been possible on traditional centralised exchanges.
Why We Built It
CoinMarketMan has spent over six years building trading intelligence and analytics tools for crypto derivatives traders. Our infrastructure has processed hundreds of millions of trade executions across tens of thousands of exchange accounts — giving us deep experience in building fast, reliable, and actionable analytics at scale.
When Hyperliquid came along, we saw the potential: an on-chain exchange with real users, growing liquidity, and fully transparent data. It was a perfect match for our analytics DNA.
Thanks to the modular systems we’ve built at CMM — both backend and frontend — we were able to pivot quickly and ship the first version of HyperTracker within a matter of weeks. It also gave us a clean slate to design a superior UX and user journey, which we plan to bring into the main CMM dashboard in future phases.
Cohorts: How We Group Wallets
We group wallets into two sets of cohorts to help you cut through the noise and extract high-signal insights: by Size and by PNL.
🧮 Size Cohorts (based on Perp Equity)
These reflect how much capital is currently deployed in open positions:
- 🦐 Shrimp: $0 – $250
- 🐟 Fish: $250 – $10k
- 🐬 Dolphin: $10k – $50k
- 🦈 Apex Predator: $50k – $100k
- 🐋 Small Whale: $100k – $500k
- 🐳 Whale: $500k – $1m
- 🌊 Tidal Whale: $1m – $5m
- 🐉 Leviathan: $5m+
📊 PNL Cohorts (based on all-time Perp PNL)
These group wallets based on lifetime perp performance:
- 💸 Money Printer: +$1m
- 📈 Smart Money: $100k – $1m
- 📊 Grinder: $10k – $100k
- 🙏 Humble Earner: $0 – $10k
- 🤡 Exit Liquidity: $0 to -$10k
- 🔥 Semi-Rekt: -$10k to -$100k
- 🚨 Full Rekt: -$100k to -$1m
- 💀 Giga-Rekt: -$1m+
Each cohort has a dedicated tile and page showing real-time wallet counts, position biases, profit split, liquidation risks, and more.
How to Use It
HyperTracker was built to be instantly useful. Here's how you can extract insights right away:
1. Cohort Overview (Homepage)
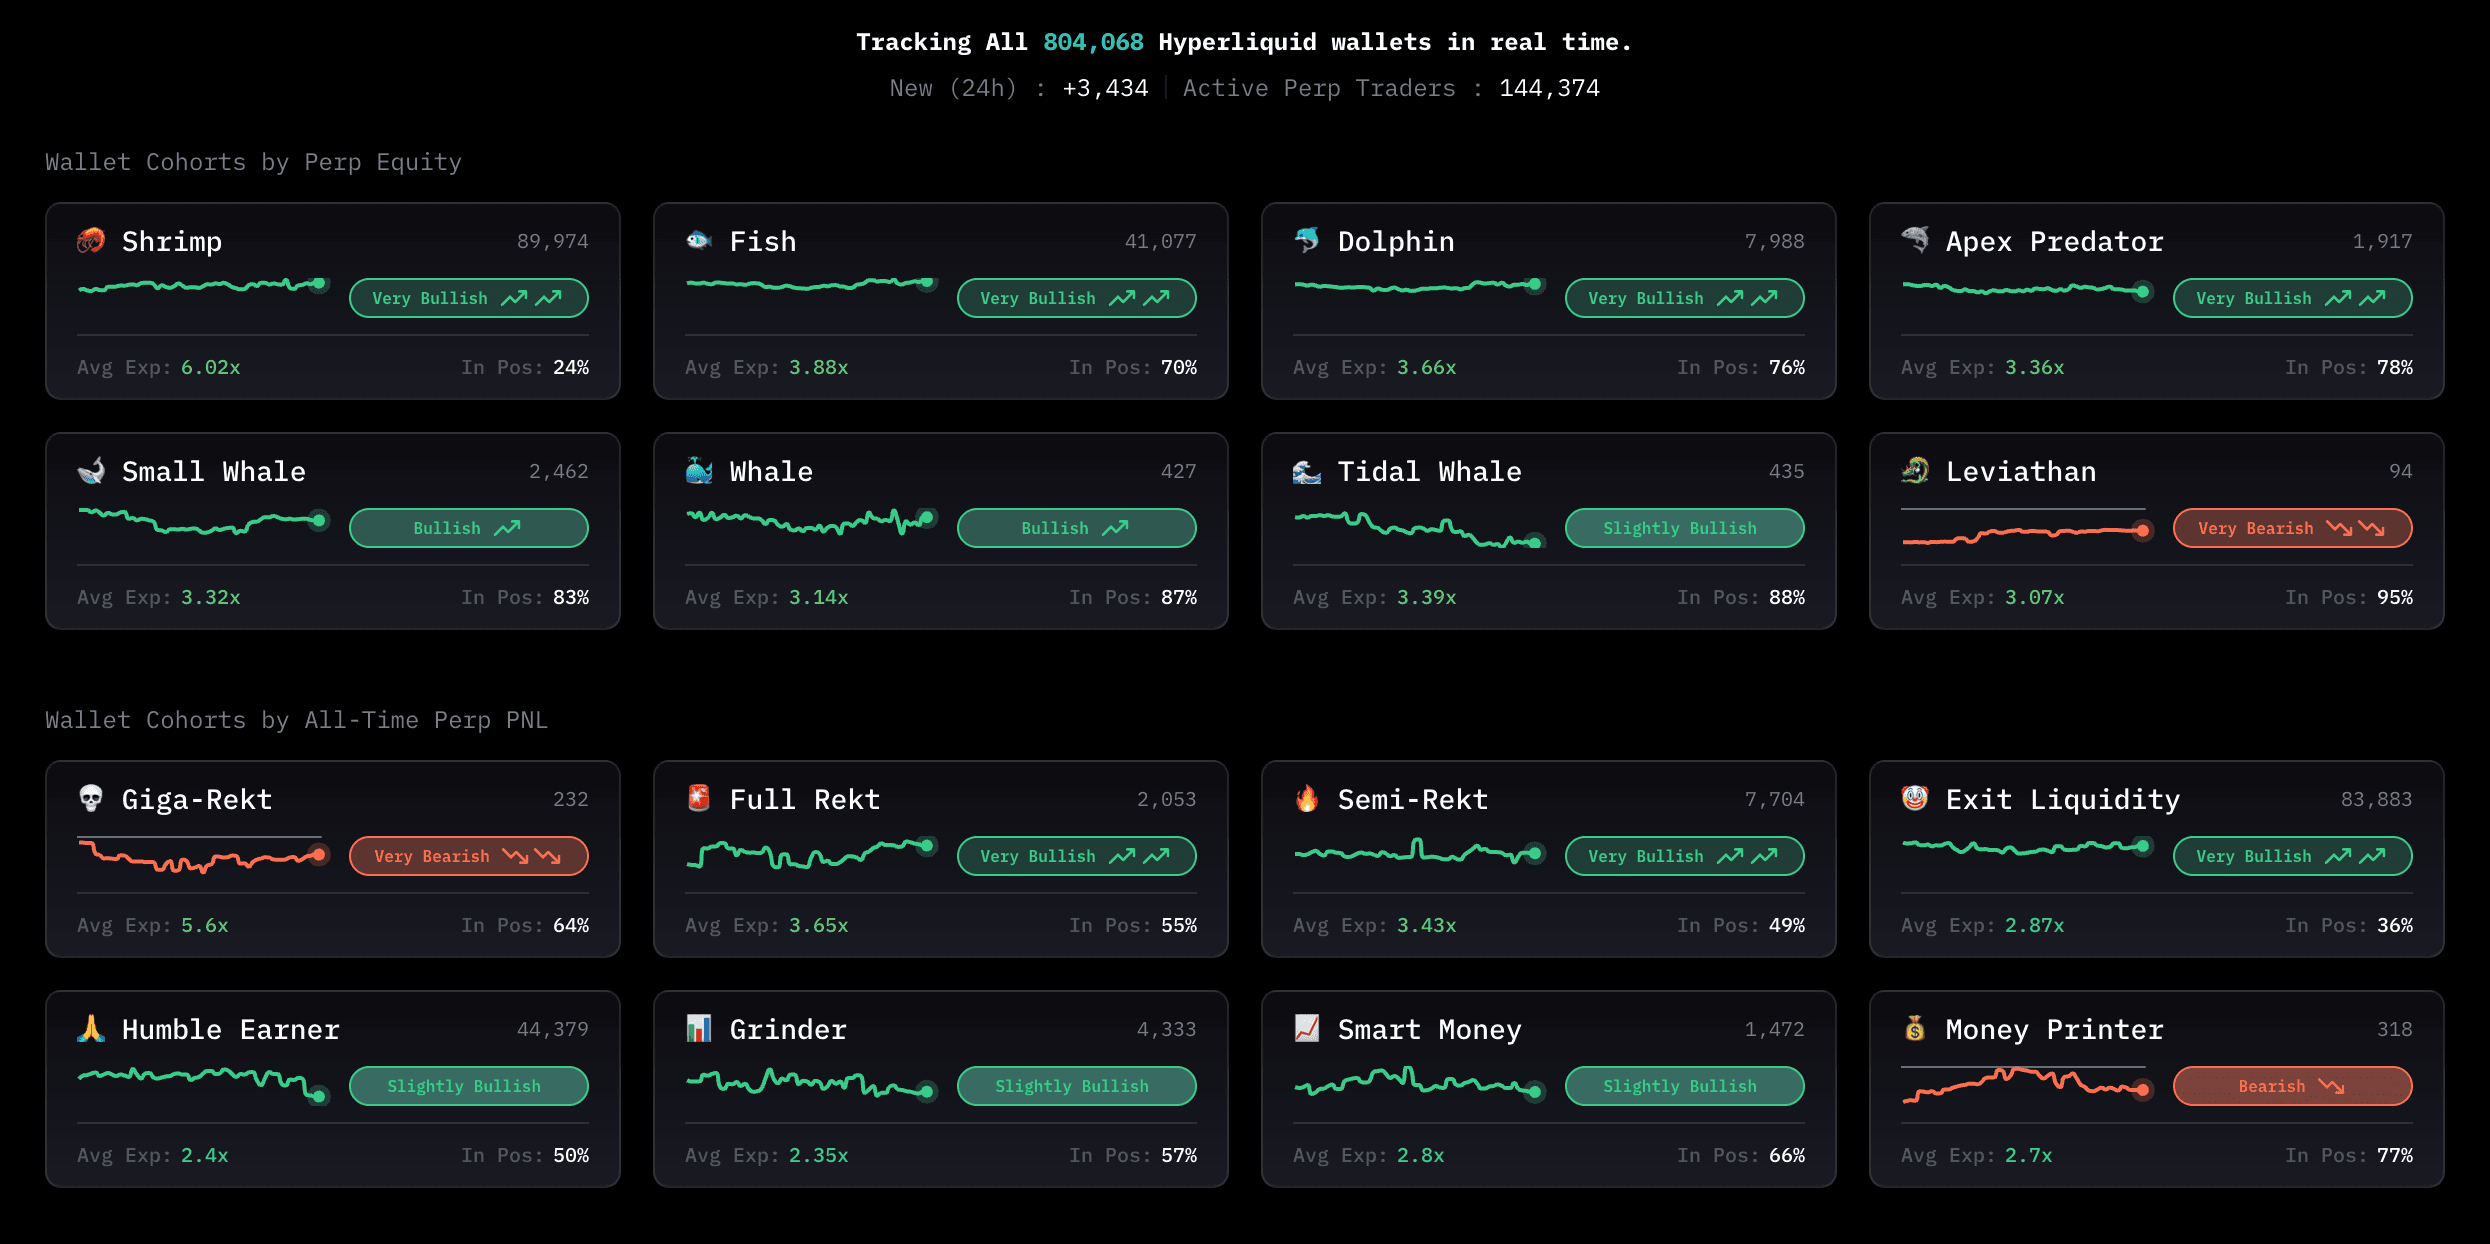
On the main dashboard, you’ll find a live-updating grid of wallet cohorts, grouped by both Perp Equity size and All-Time PnL performance.
Each tile now includes:
- Number of wallets currently in the cohort
- % of wallets currently in position (actively holding perp positions)
- A real-time Perp Bias bar showing the current long vs short sentiment
- A 72-hour bias trend line, visualising how sentiment has evolved over time
- Average exposure ratio, which shows the average position size relative to account equity - a useful signal for gauging conviction or overextension
Click into any cohort to drill deeper into trade activity, open positions, and directional bias by asset.
2. Cohort Pages: Deep Dive by Group
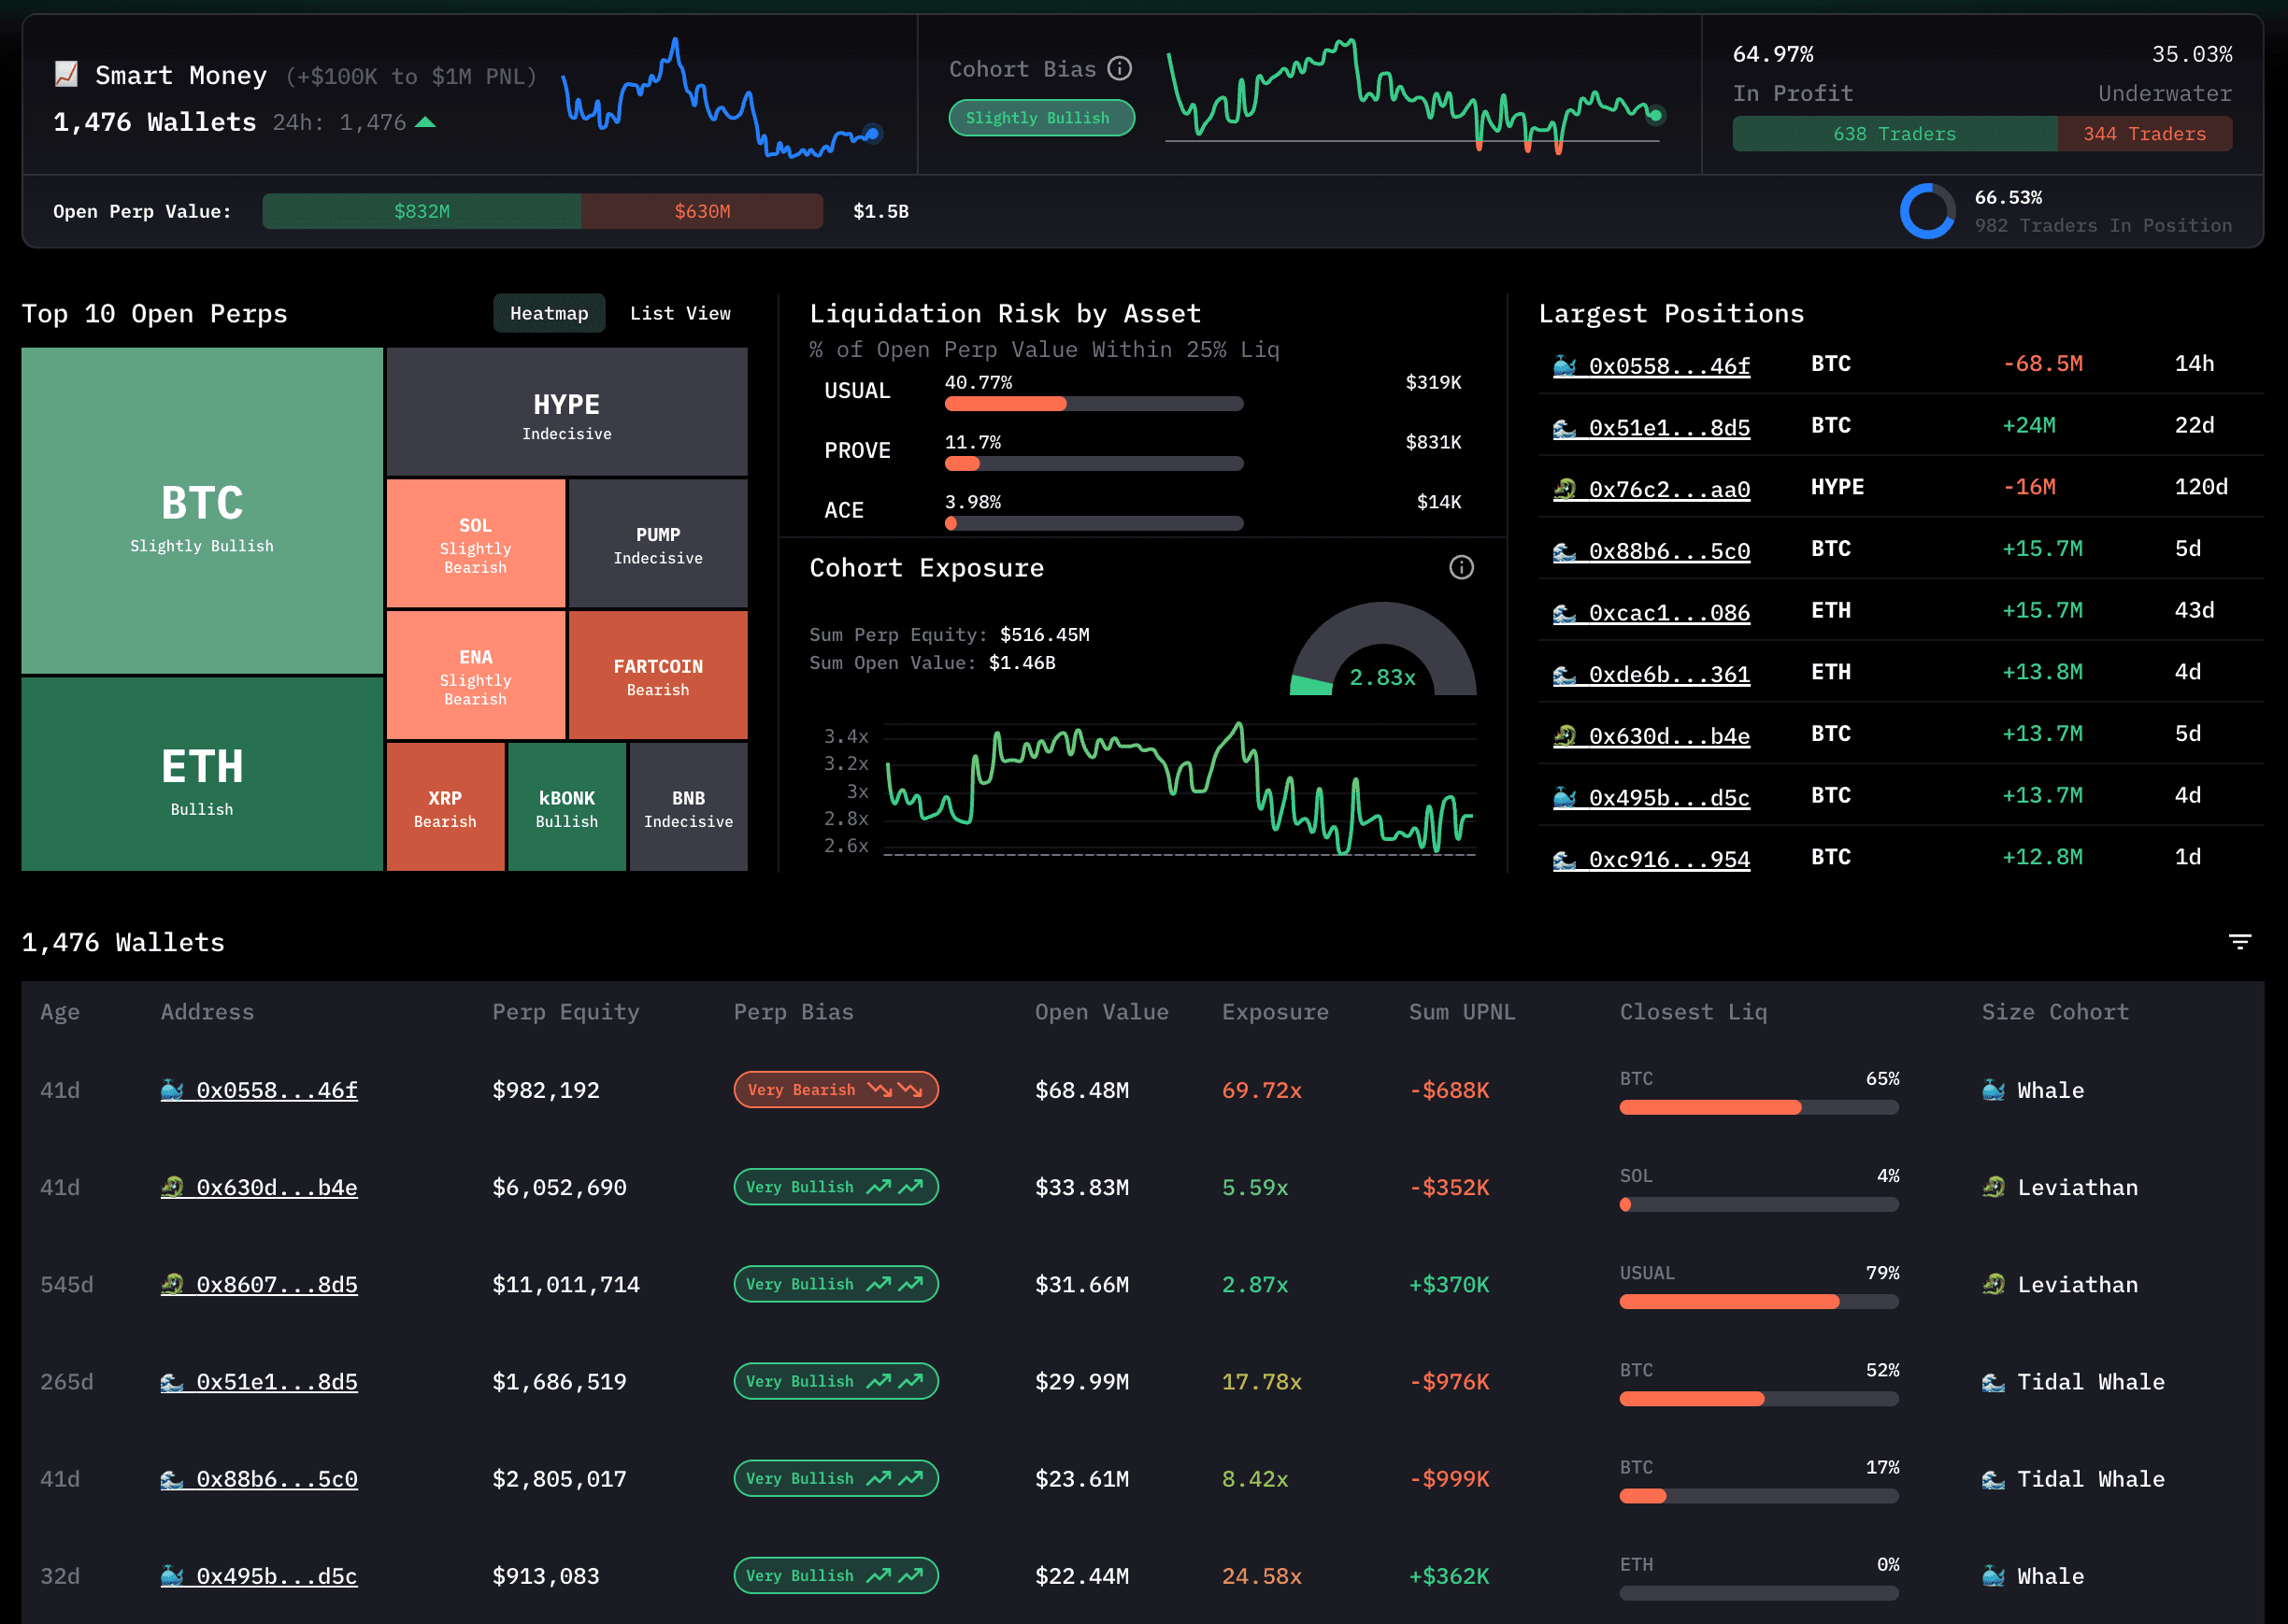
Clicking into any cohort from the homepage takes you to a deep-dive dashboard built to show exactly how that trader class is behaving and where their biggest risks and bets lie.
At a glance, you'll see:
Top Summary Panel (Top Row)
- Cohort Growth Trend (14d): A sparkline chart showing how the number of wallets in this cohort has changed over the past 14 days. Useful for spotting momentum in trader migration.
- Cohort Bias Trend (14d): Tracks how the overall long/short sentiment of the cohort has shifted. Bullish, bearish, or indecisive.
- P&L Distribution: Shows what % of wallets in this cohort are in profit vs. underwater, with actual wallet counts.
Deep Data Panels
- Top 10 Open Perps Heatmap: Tiles sorted by open position value, colour-coded by bias. Instantly shows where this cohort is concentrated and how they feel about those assets.
- Liquidation Risk by Asset: Highlights the % of open perp value within 25% of its liquidation price; a quick way to see where risk clusters are forming.
- Cohort Exposure Trend (14d): Visualises the average exposure ratio over time. Are traders getting more aggressive or scaling back?
- Largest Open Positions: Table of the biggest open positions, with wallet links, position value, asset, profit/loss, and now including the position age (how long the trade has been held).
Wallet Explorer Table
- A detailed table of every wallet in the cohort, showing:
- Wallet age
- Perp equity
- Current perp bias
- Open position value
- Exposure ratio (open position size vs wallet equity)
- Sum UPNL
- Position with the closest distance to liquidation
- Size-based cohort label (e.g. Whale, Dolphin)
This page gives you everything you need to understand a cohort’s risk appetite, positioning, conviction, and potential vulnerability, updated in real time. Watch how smarter cohorts evolve. Spot overleveraged traders. Or just snoop on the biggest plays.
3. Wallet Explorer
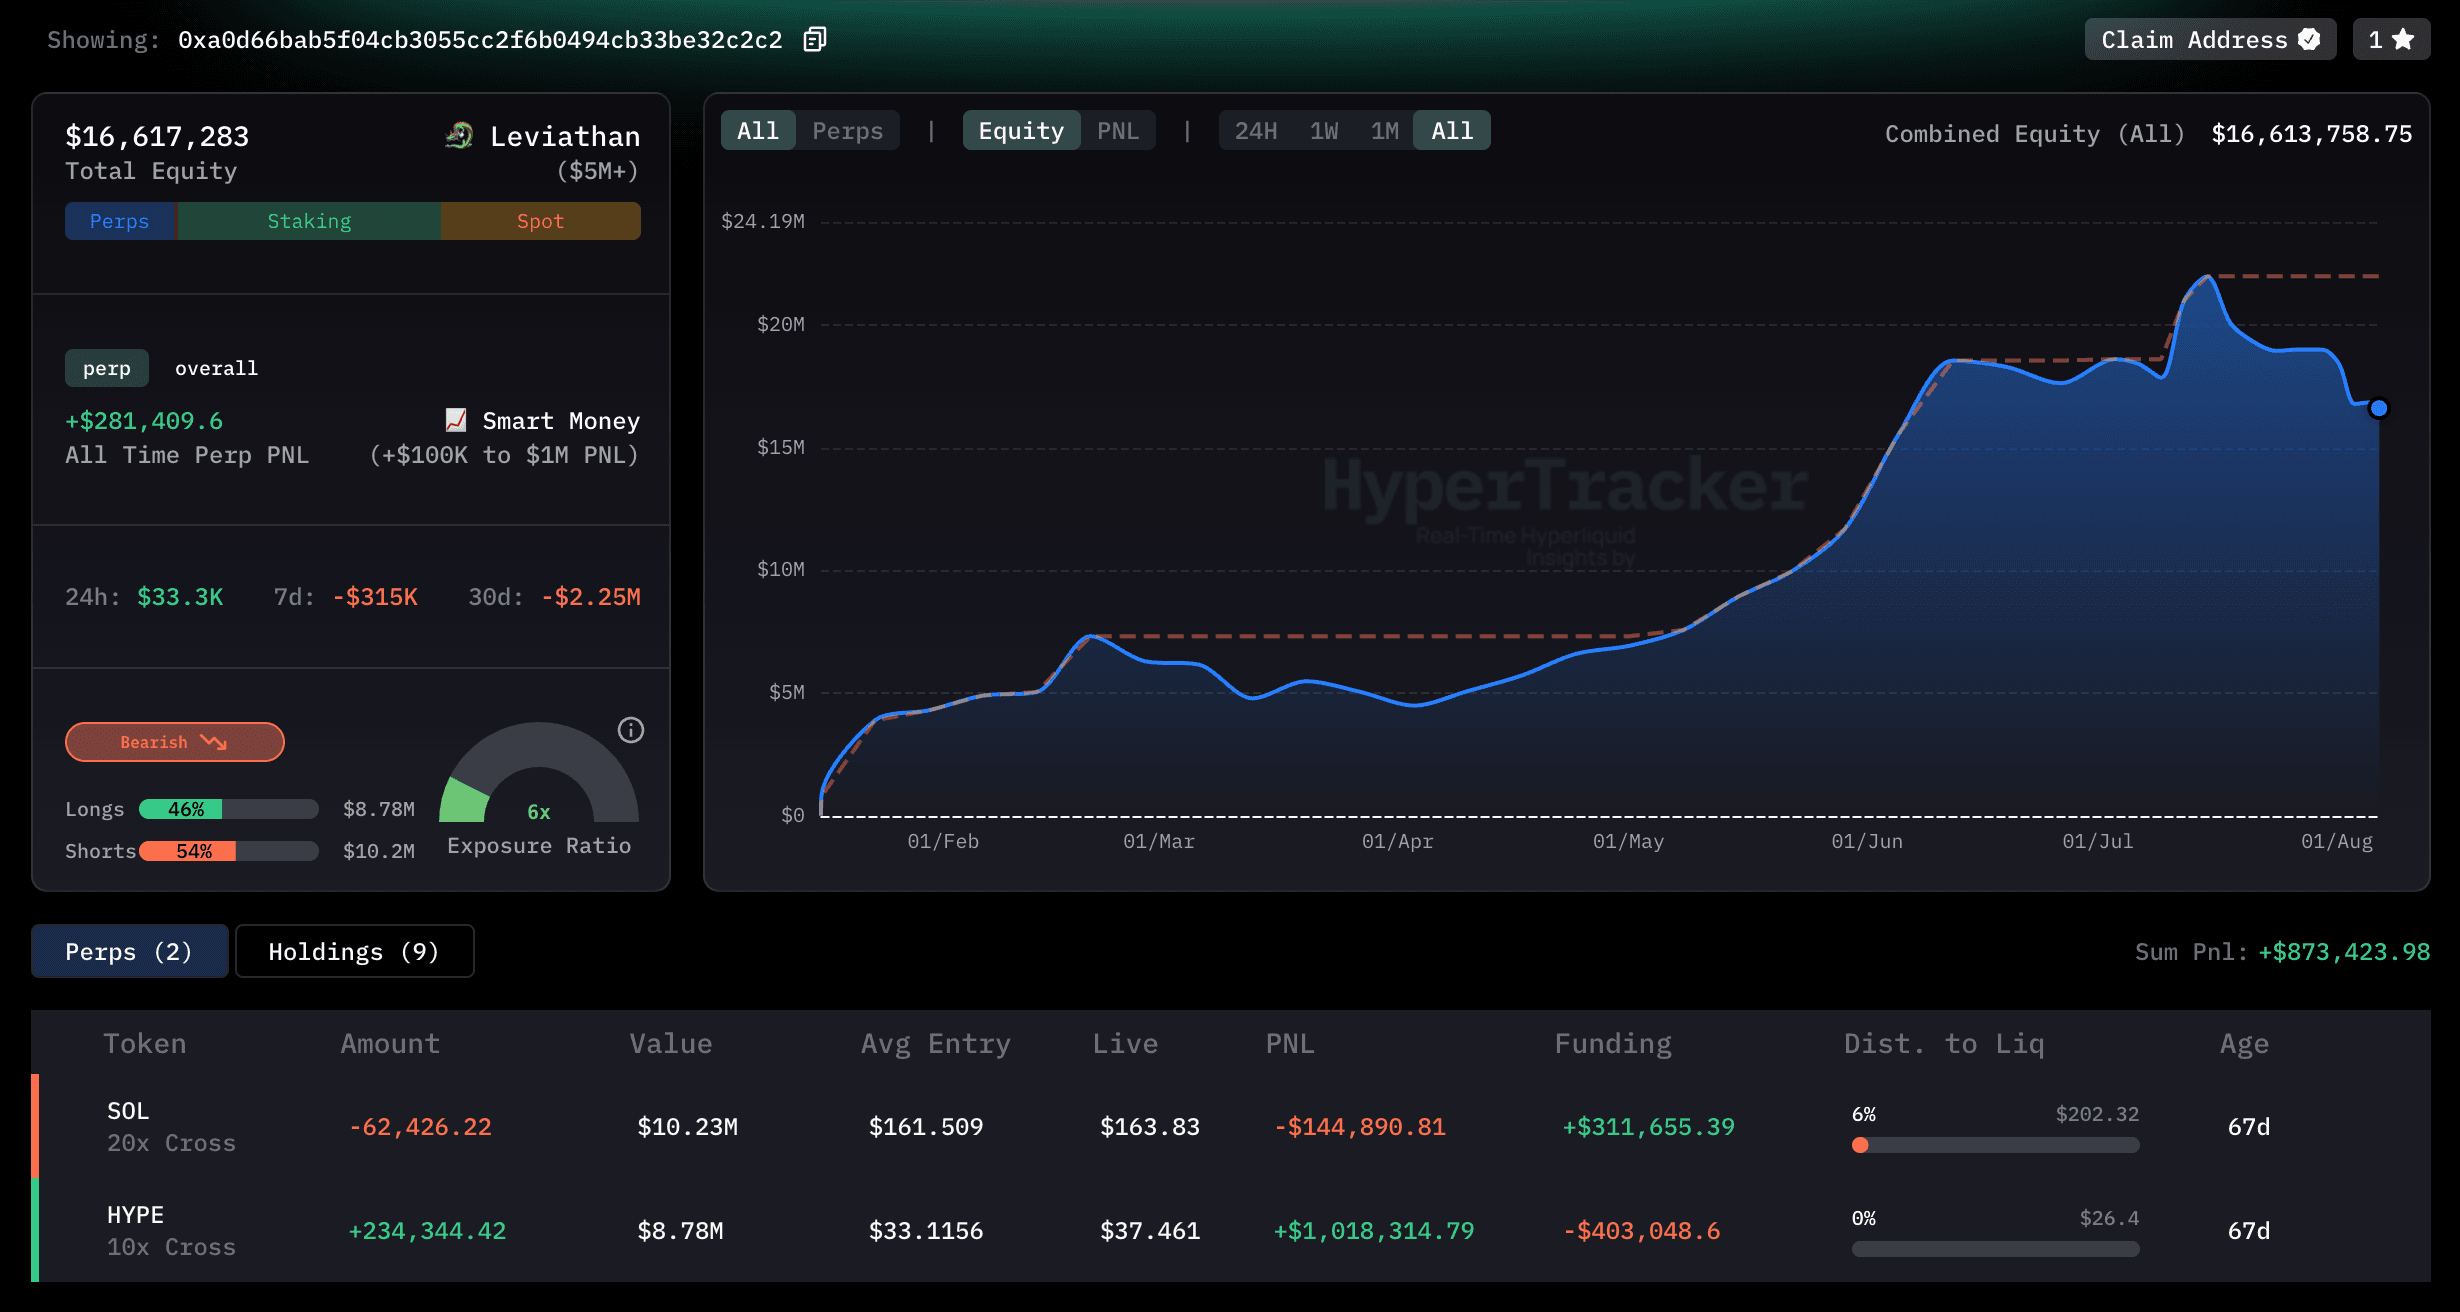
Want to zoom in on a single trader? The Wallet Explorer gives you a powerful, real-time x-ray into their trading behaviour, strategy, and risk profile.
You’ve got two ways in:
- Click any wallet address from any table.
- Paste a wallet address into the search bar at the top of the dashboard
Once you're in, you'll see a fully detailed trader profile, including:
Lifetime Equity + PnL Chart
- A live-updating chart showing the wallet’s combined equity and PnL over time, across both staking and trading activity. Includes:
- Drawdown metrics
- Timeframe filters (24h / 7d / 30d / All time etc.)
Active Perp Positions Table
A breakdown of the wallet’s current open trades, with:
- Token, side, and leverage
- Average entry vs. live price
- PnL and funding
- Distance to liquidation
- Position age
- Exposure ratio — the size of the trade relative to the wallet's total equity
Wallet Claiming & Personalisation
Wallet owners can now claim their address, set a custom name, choose an emoji badge, and link their X (Twitter) account for public attribution
Claimed wallets gain visibility across the dashboard, and give users a way to show off performance transparently
Favourites
Any wallet can now be favourited and added to your personal watchlist. Perfect for keeping tabs on the sharpest (or most reckless) traders over time.
4. Perps Pages
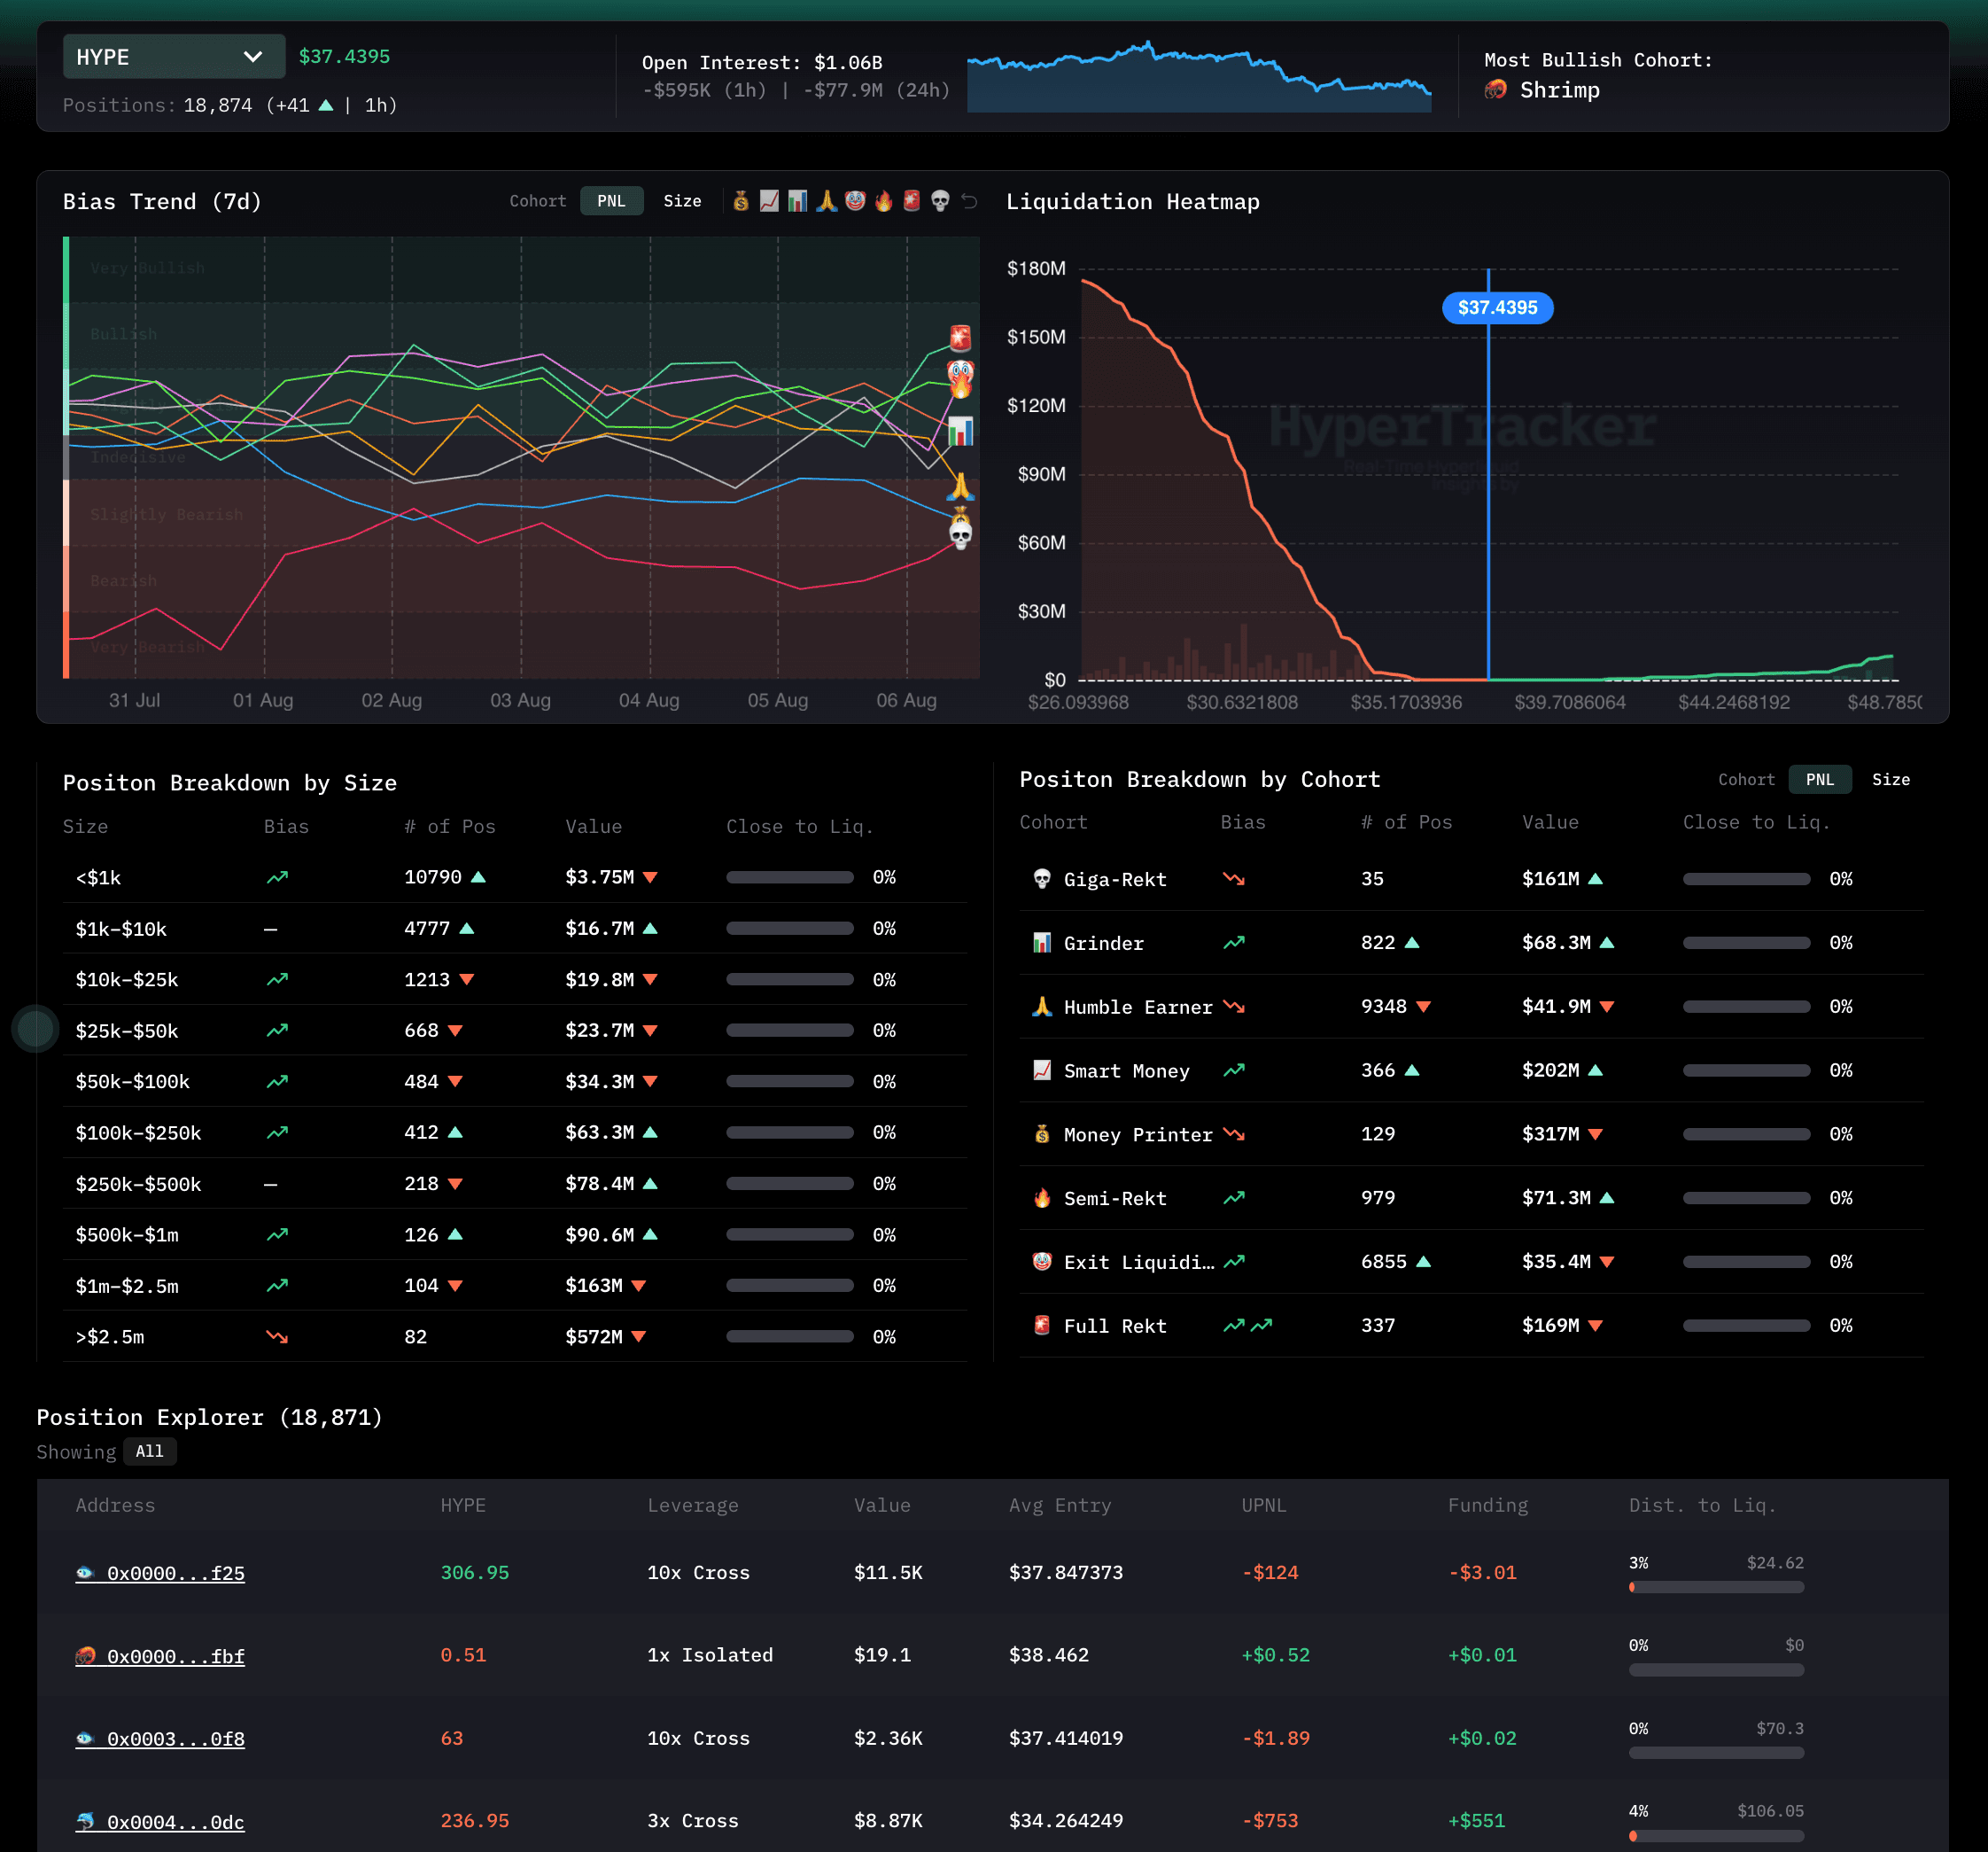
The Perps Pages are your command centre for tracking real-time sentiment, positioning, and liquidation risk across every perp on Hyperliquid.
Each token has its own dedicated page, with a clean, visual breakdown of trader behaviour, helping you make sense of the flow behind every chart candle.
What You’ll See:
- Bias Flow Chart (72h)
Track how long/short sentiment has shifted across different cohorts over the past 7 days. Ideal for spotting momentum swings and sentiment flips. - Cohort Bias Breakdown
Instantly compare how different trader cohorts (Shrimp, Whale, Smart Money, etc.) are positioned. Are the big wallets long while retail is short? - Liquidation Risk Map
A visual gauge of how much perp value is sitting within 25% of its liquidation price. Helps you anticipate where forced moves or liquidations may cluster. - Live Open Interest Breakdown
Compare total perp size across cohorts — are whales ramping up size? Are certain tokens suddenly attracting more leverage?
5. Global Position Heatmap
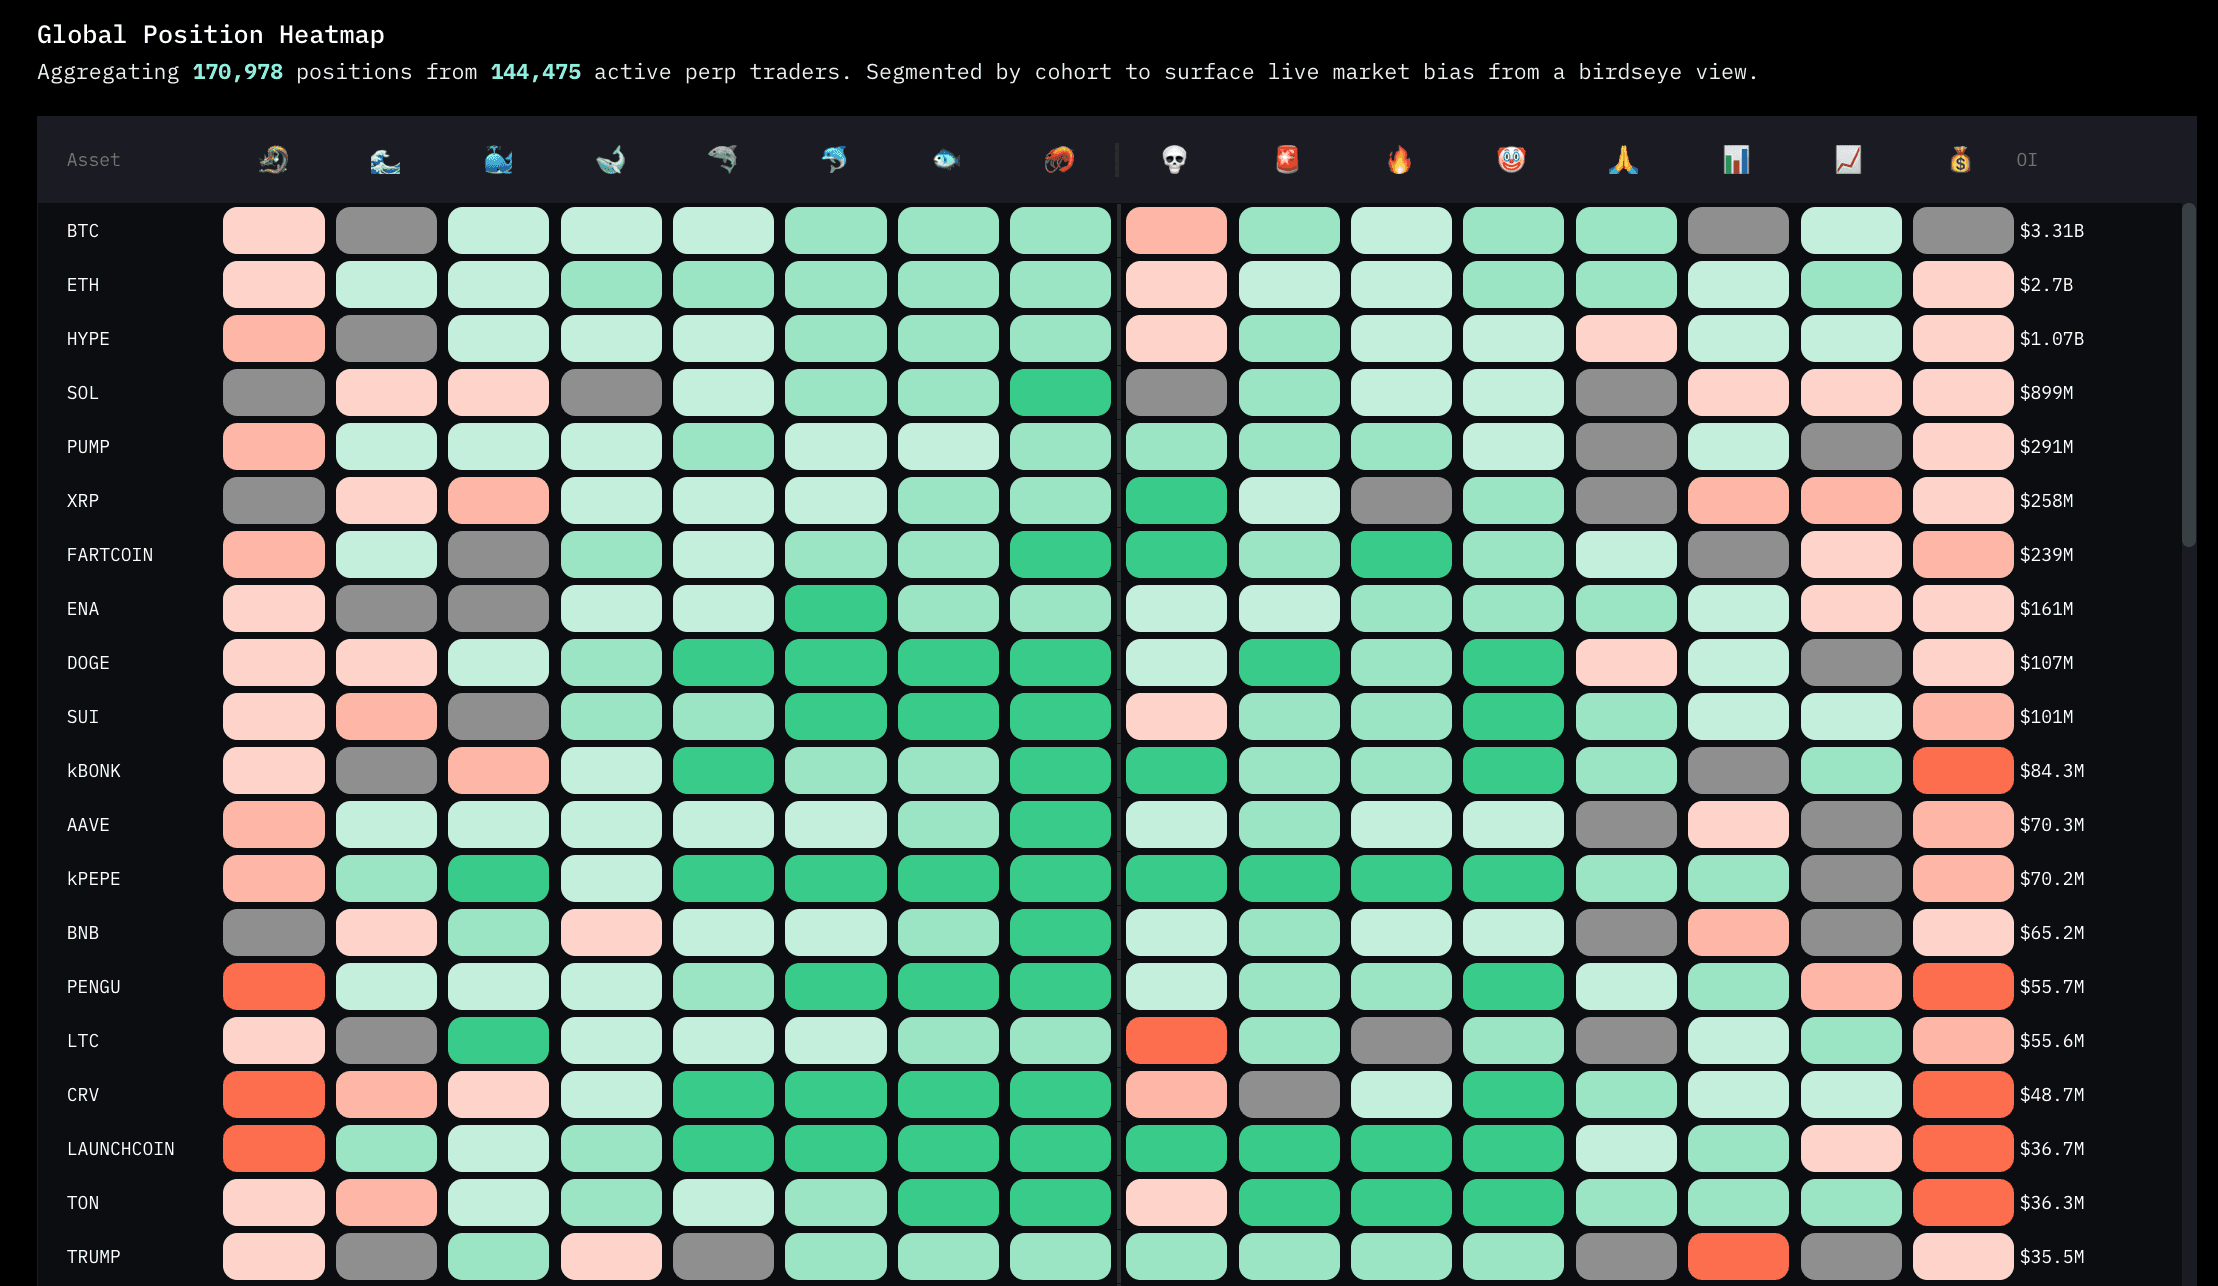
The Global Position Heatmap gives you a bird’s-eye view of market bias. Aggregated from every single active position currently on Hyperliquid, updated every ~10 minutes.
Each row = a token
Each column = a trader cohort
Each tile = real-time sentiment
The colours show live long/short bias for each cohort-token combo
🔍 Click Any Tile to Go Deeper
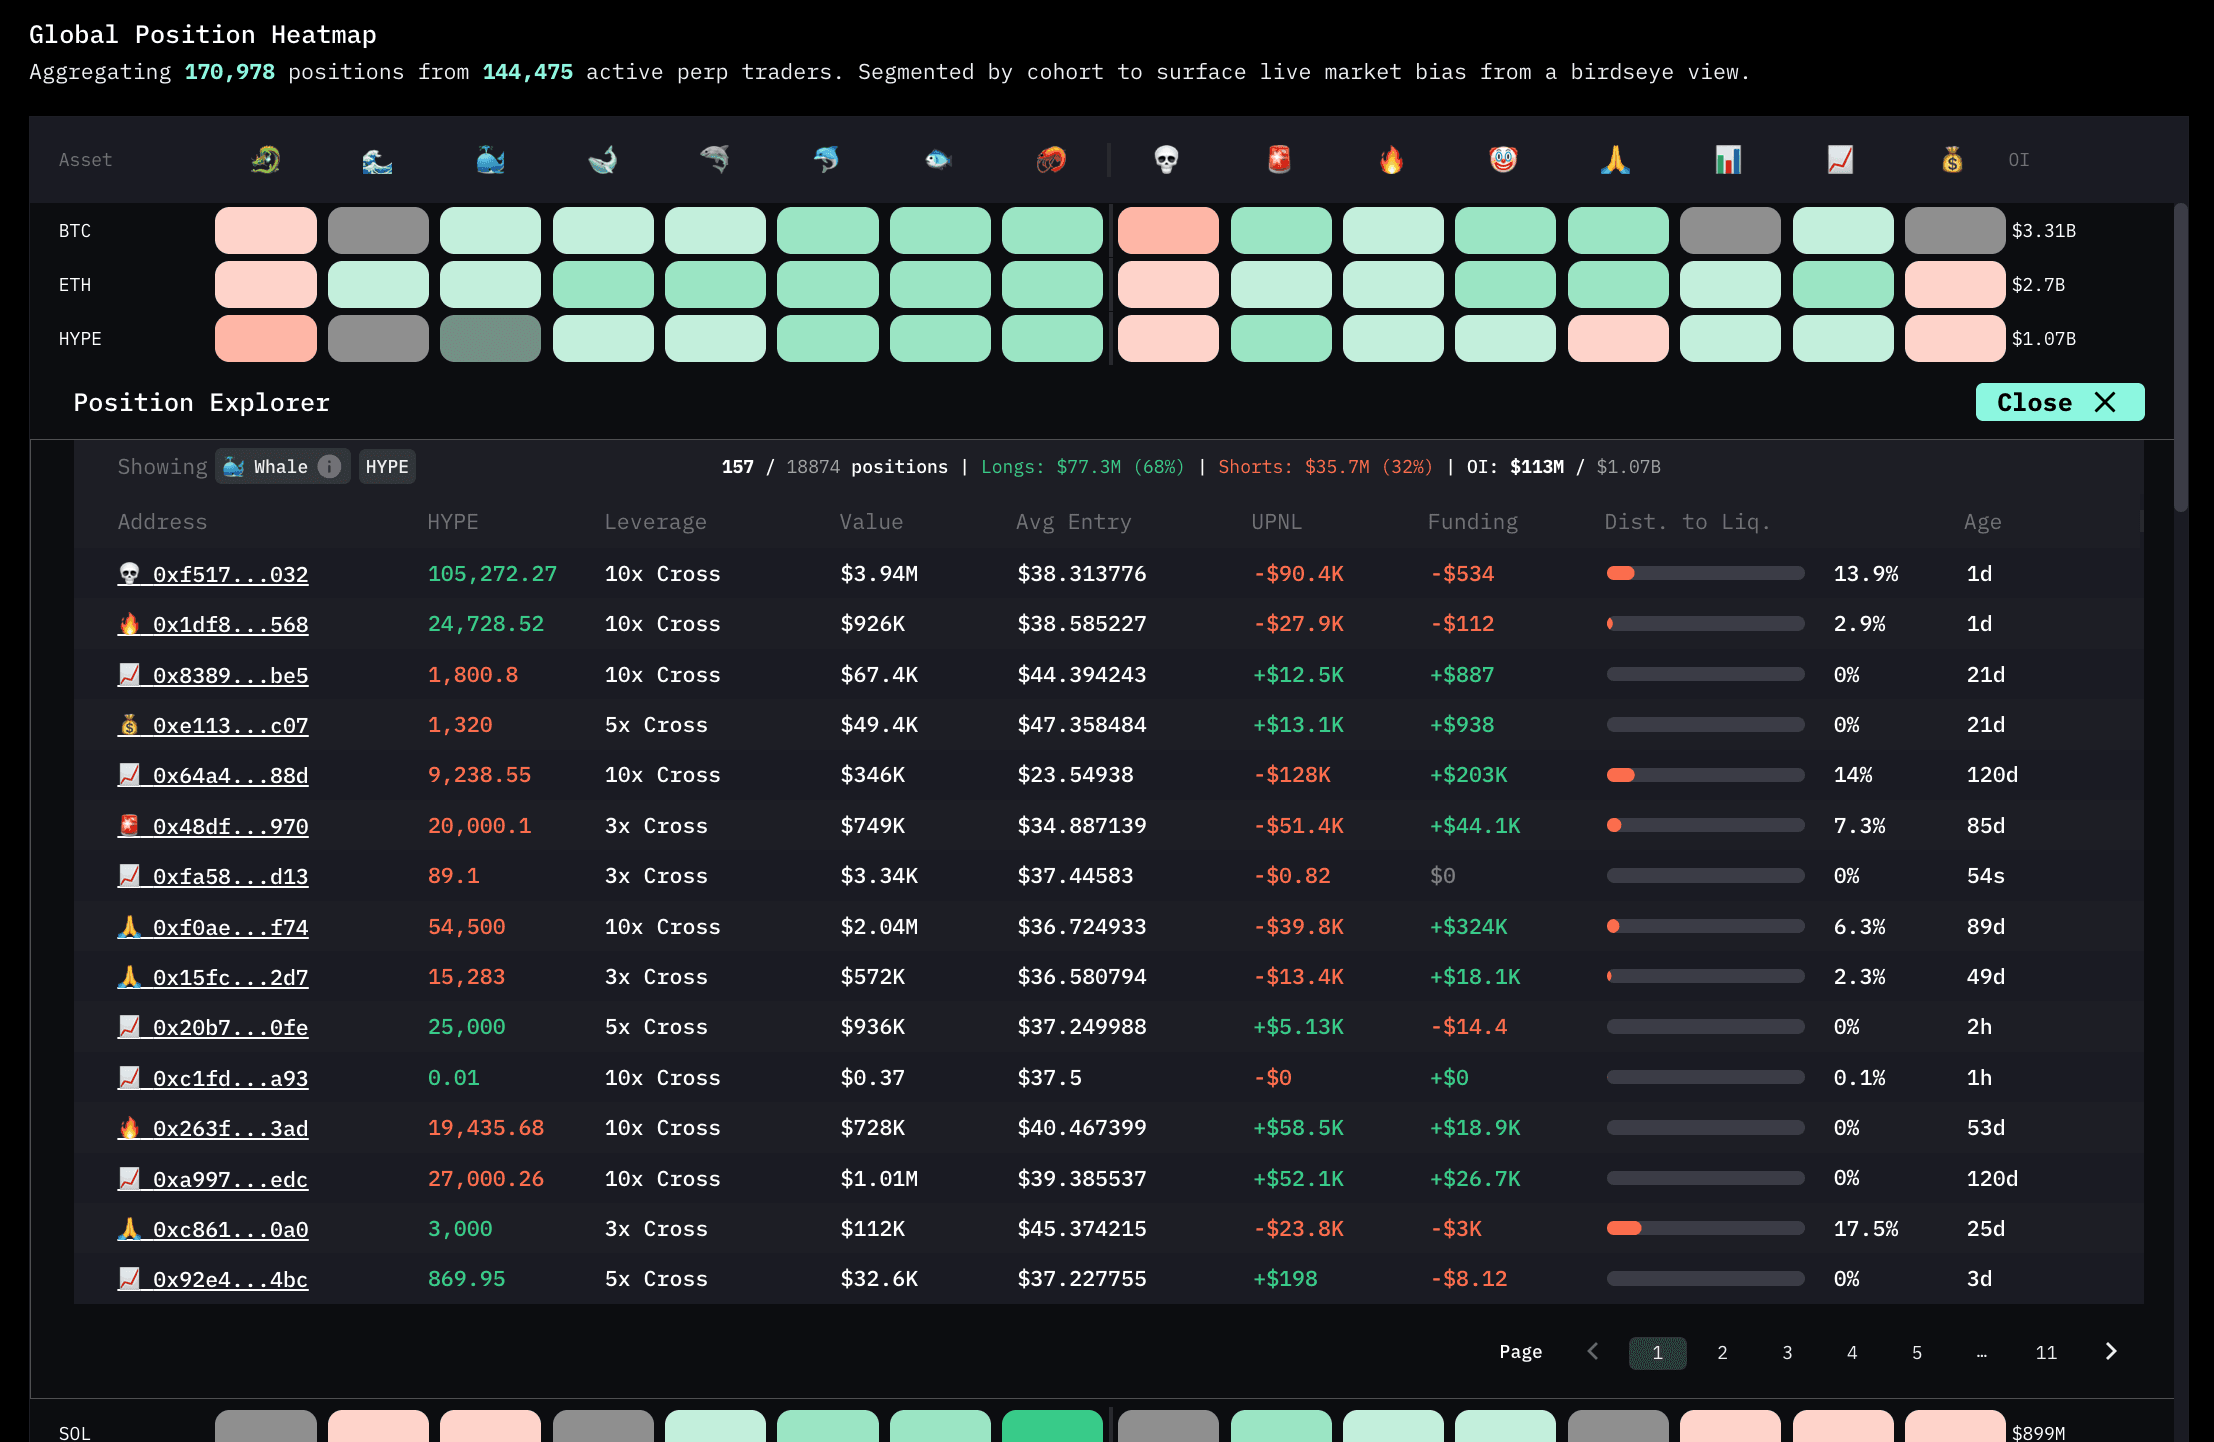
Want to know exactly who is long HYPE in the Whale cohort? Or which Whale wallets are overexposed to FARTCOIN?
Just click any tile to expand that view into a full Position Explorer, where you’ll see:
- All associated wallet addresses
- Trade size, entry, and current PnL
- Leverage, funding paid, distance to liquidation, and position age
This gives you unprecedented transparency letting you go from global macro bias to individual trader breakdowns in one click.
Learn How It’s Calculated
Our long/short bias calculations and exposure metrics are outlined in the HyperTracker About section if you want to dive into the methodology.
The Global Heatmap is the fastest way to scan sentiment shifts across the chain — whether you’re trying to fade degens, follow smart money, or front-run liquidation clusters.
6. Live Builder Analytics
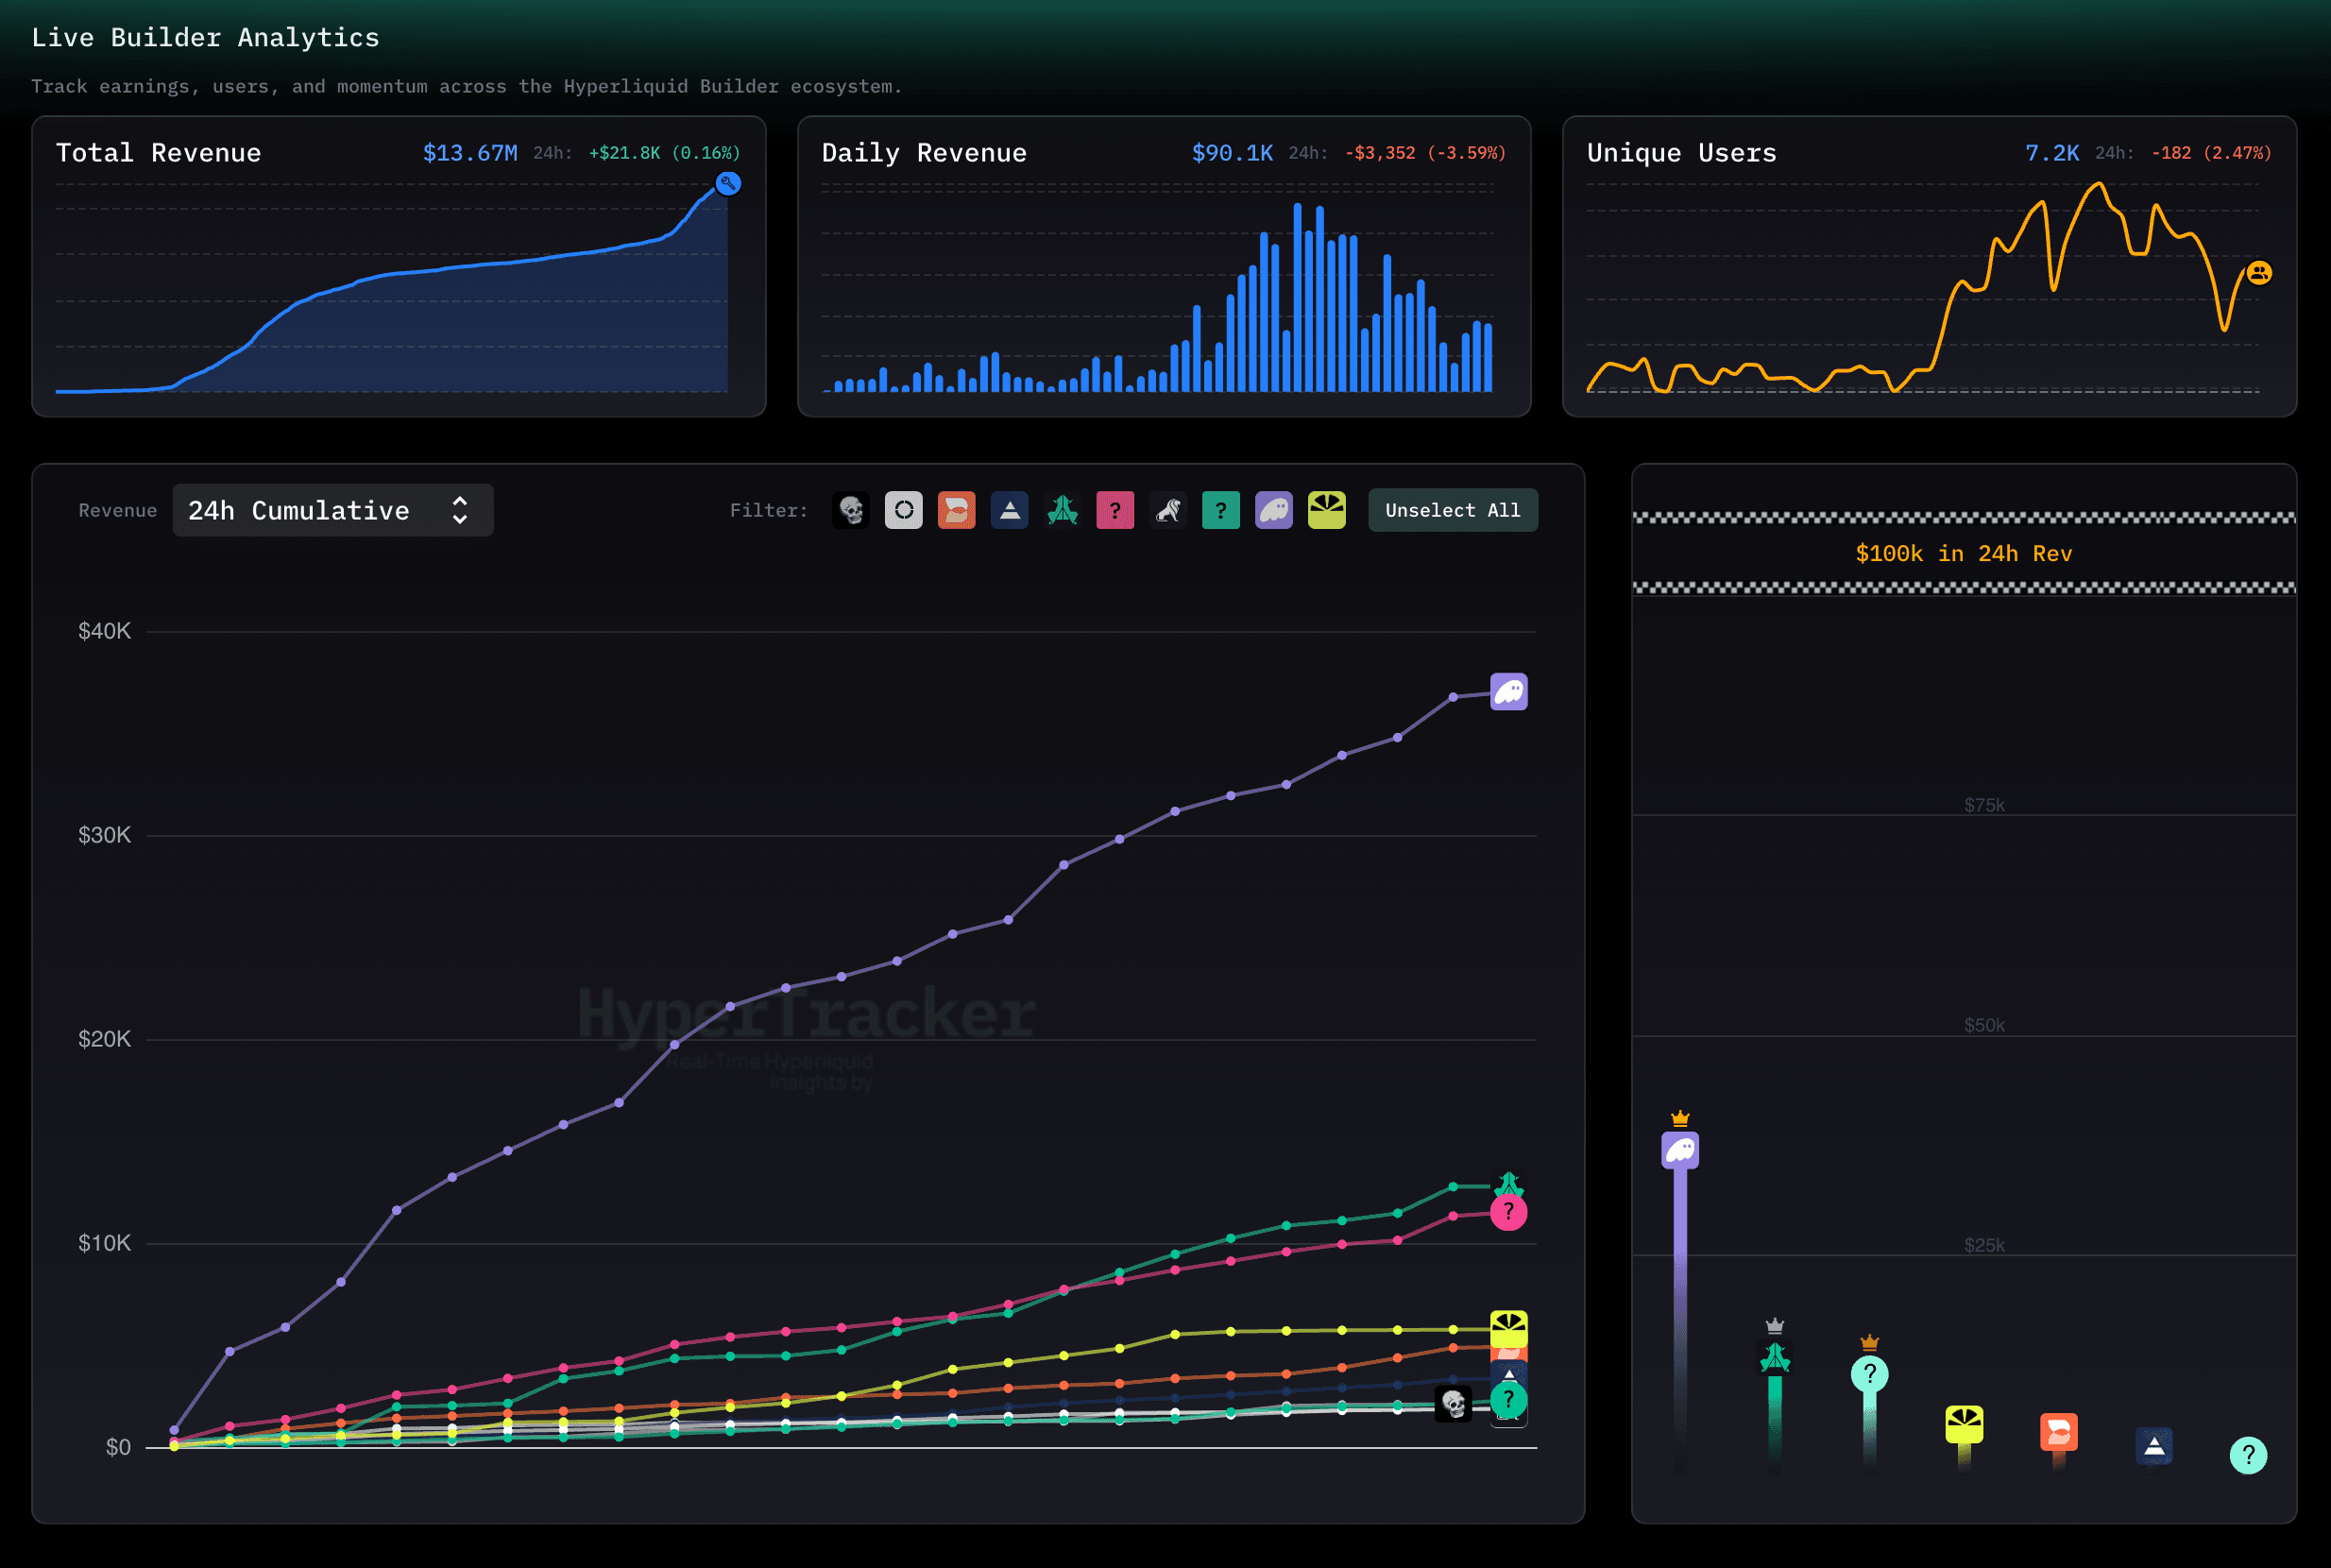
Welcome to the Builder Era — where some of the most impressive tools in crypto are being built on top of Hyperliquid, and generating millions in fees along the way.
Our Live Builder Analytics section tracks the entire Hyperliquid Builder ecosystem in real time, helping you follow the rise of high-performing builders like Phantom, who generated $1.6M+ in revenue in under two months at the time of writing.
🚀 What You’ll See
- Total Revenue Leaderboard
Watch the ecosystem evolve daily, with side-by-side comparisons of builder revenue performance across 24h, 7d, and 30d windows. - Performance Charts
Visualise revenue and user growth over time. See which builders are gaining traction and which are plateauing. - Unique Users & Daily Revenue Flows
Spot builder breakouts early by tracking user growth curves and revenue spikes. - Coin Volume Distribution
See which tokens are generating the most trading volume per builder, broken down across timeframes. - User-Level Table
Explore individual trader stats within each builder including perp equity, total volume, profitability, and fees generated.
📁 Builder Profile Pages
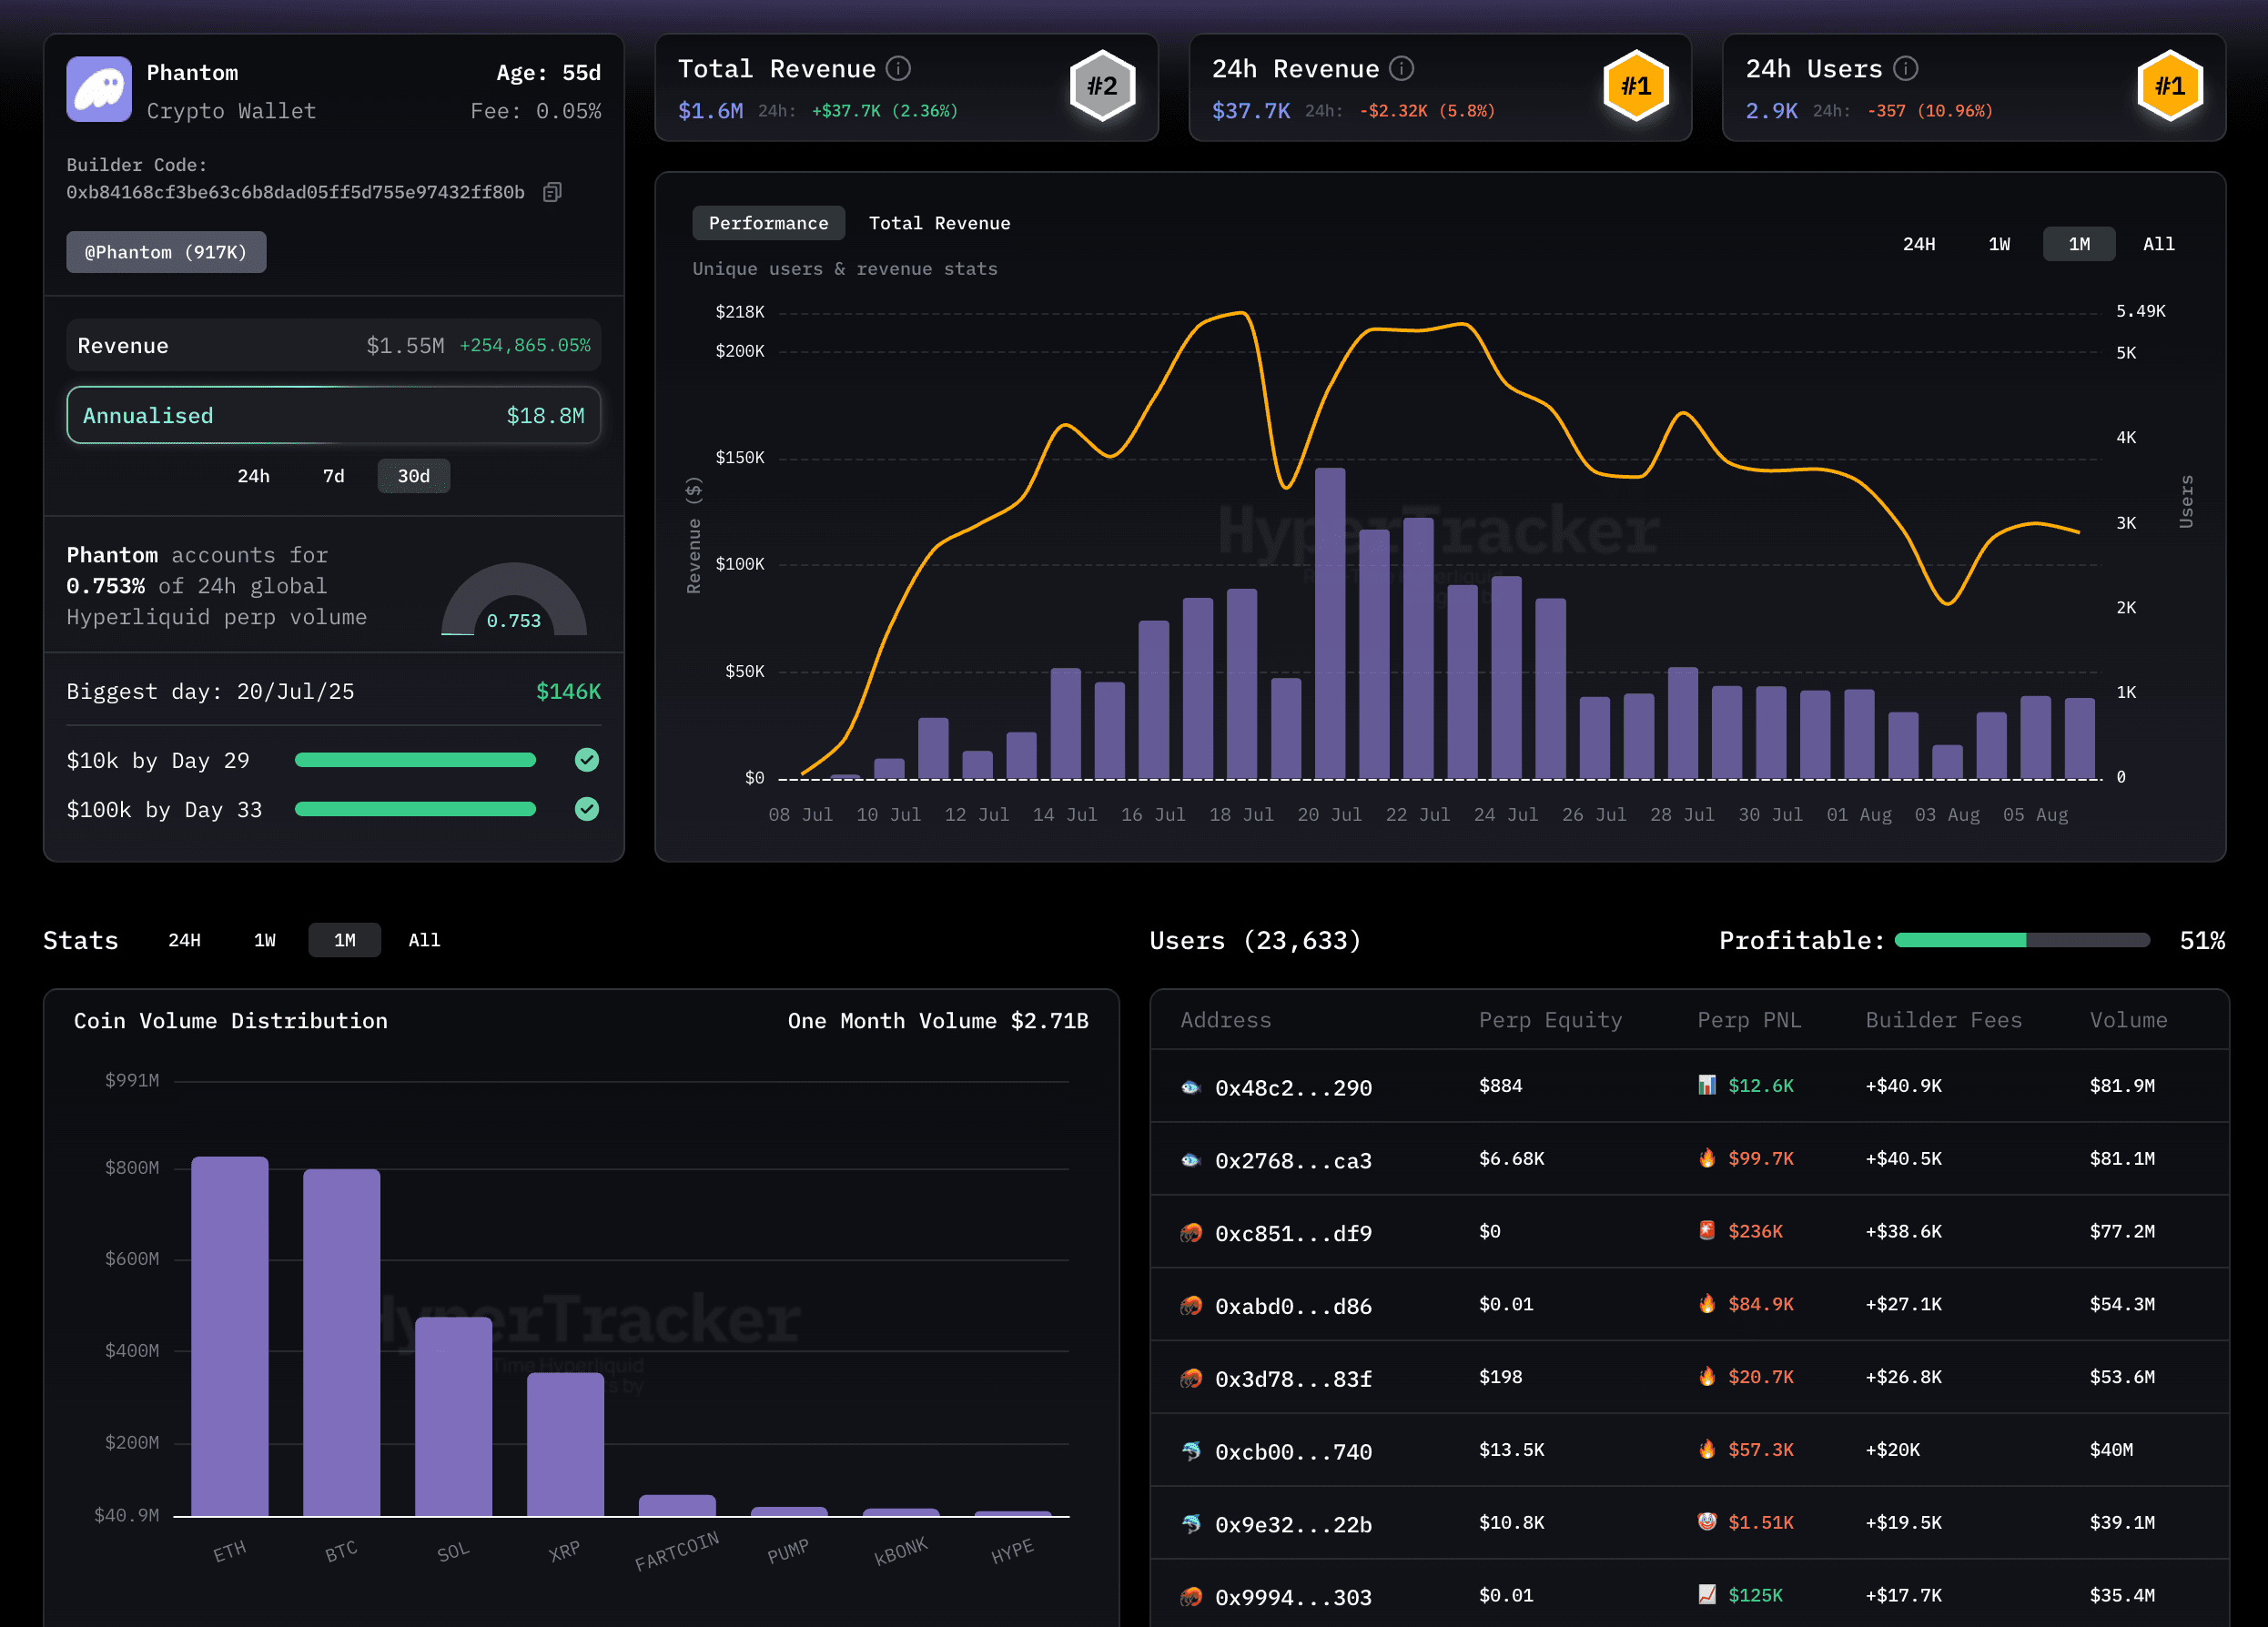
Click on any builder in the main table to open their dedicated profile, where you can explore:
- Daily revenue breakdowns
- User and volume growth
- Top tokens and most active traders
- Time-based milestones (e.g., how quickly they hit $10k, $100k in rev)
- Share of global Hyperliquid volume
The Hyperliquid builder ecosystem is exploding with innovation, and HyperTracker is the best place to watch it all happen with unmatched transparency, granularity, and real-time updates.
What’s Coming Next
Here’s what we’re working on now:
- 🧠 Custom Cohorts — build your own wallet groups
- 🔔 Real-Time Alerts — set triggers on assets, bias shifts, or individual wallets
We plan to keep the core HyperTracker experience free and publicly accessible, so anyone can benefit from real-time on-chain insights. That said, features like custom cohort building, alerts, and other advanced tools may require login and in future, some may be offered as part of a paid tier.
Our approach will remain dynamic, and we’ll continue adapting based on feedback and usage patterns. We'll be transparent about what changes and why.
But our north star remains the same: deliver game-changing trading intelligence, in a dashboard that’s clean, fast, and intuitive enough for anyone to understand.
Stay in the Loop
HyperTracker is a living tool — and we’re shipping fast. Here’s how to stay up to date:
👉 Follow @CMMHyperTracker on X
👉 Bookmark HyperTracker in your browser
👉 Check back here — this blog will be updated as features go live