Order Flow Analysis 101: Reading Hyperliquid's Market Microstructure
By CMM Team - 09-Mar-2026
Order Flow Analysis 101: Reading Hyperliquid’s Market Microstructure
Price charts tell you what happened. Order flow tells you why. If you trade perpetual futures on Hyperliquid and you’re only looking at candles, you’re seeing the aftermath of a battle without knowing who’s fighting.
Order flow analysis strips away the abstraction. Instead of interpreting lagging indicators, you study the raw mechanics of the market: who is buying, who is selling, how aggressive they are, and where the big players are positioned. On a fully on-chain exchange like Hyperliquid, this information is richer than anything available on centralized venues, because every trade, every position, every liquidation lives on a transparent ledger.
This guide covers the core concepts of order flow analysis and shows how they apply to Hyperliquid’s unique market microstructure. Whether you’re building trading bots, managing a quant portfolio, or just trying to stop getting faked out by whale moves, understanding order flow is the foundation.
What Is Order Flow Analysis?
Order flow analysis is the study of actual buy and sell orders moving through a market. Traditional technical analysis focuses on price and time. Order flow adds a third dimension: intent. By watching how orders enter the book, execute, and get pulled, you can read the behavior of market participants before price fully reflects their actions.
In traditional finance, order flow analysis has been a staple of institutional trading desks for decades. Futures pit traders in Chicago literally watched the flow of orders come through their booths, reading the urgency and size of each ticket. The digital equivalent replaces the trading pit with data feeds, but the principle is identical: follow the money.
Crypto perpetual futures are particularly suited to order flow analysis for several reasons. They trade 24/7 with no settlement breaks, so the flow never stops. Leverage amplifies positioning signals because traders put up real collateral to express directional views. And on Hyperliquid specifically, every trade settles on-chain, which means the data is verifiable and complete.
The Core Order Flow Indicators
Four indicators form the backbone of order flow analysis in crypto perpetual futures. Each one answers a different question about market behavior, and together they paint a detailed picture of what’s happening beneath the surface of price action.
- CVD — Buying vs. Selling Pressure
- OI — Capital Commitment
- Funding — Directional Crowding
- Liqs — Forced Exits
Cumulative Volume Delta (CVD): The Pressure Gauge
CVD tracks the difference between aggressive buying volume and aggressive selling volume over time. When a trader places a market buy order, that volume gets counted as “buy volume.” Market sells count as “sell volume.” CVD is the running total of that difference.
Why does this matter? Because market orders represent urgency. A limit order sits passively in the book, waiting to get filled. A market order demands immediate execution. When CVD is rising, more traders are aggressively buying than selling. When it’s falling, sellers are in control.
The real power of CVD shows up in divergences. If price is making new highs but CVD is flat or declining, the rally is running on fumes. Buyers aren’t driving price higher with conviction. Instead, price is climbing because sellers are stepping away, which means the advance is fragile. The same logic works in reverse: price making new lows while CVD rises suggests sellers are losing steam and a reversal may be forming.
Practical example: BTC perps on Hyperliquid are trading at $95,000 and pushing toward $96,000. Price ticks up, but CVD over the last 4 hours has been declining. That means market sells are outpacing market buys even as price rises. The move is being driven by thin liquidity above. Genuine buying pressure is absent. This is exactly the kind of setup where price snaps back hard once a real seller shows up.
Open Interest: Following the Money
Open interest (OI) measures the total number of outstanding perpetual futures contracts. Every time a new position opens (a new buyer meets a new seller), OI increases by one contract. When a position closes, OI decreases.
OI tells you whether new money is entering or leaving the market. Rising OI during a price move means conviction: traders are opening fresh positions to bet on the trend continuing. Falling OI during a price move means the opposite: existing positions are being closed, and the move is driven by unwinding rather than new commitment.
Reading OI + Price Together
| Price | Open Interest | Interpretation | | --- | --- | --- | | Rising | Rising | Strong uptrend. New longs entering. Bullish conviction. | | Rising | Falling | Short squeeze. Shorts are closing. New longs are absent. Fragile. | | Falling | Rising | Strong downtrend. New shorts entering. Bearish conviction. | | Falling | Falling | Long liquidation. Longs are exiting. Fresh shorts are absent. Could be near a bottom. |
On Hyperliquid, OI data is particularly valuable because you can see it broken down by the type of trader. Through cohort analytics, you can distinguish whether OI growth is coming from large experienced traders (“smart money”) or smaller retail participants. That distinction changes the interpretation entirely: rising OI from whale-class accounts carries far more weight than the same OI increase from smaller traders.
Funding Rates: Who’s Crowded
Perpetual futures don’t expire, so they use a funding rate mechanism to keep the contract price anchored to the spot price. When the perp trades above spot (long-heavy market), longs pay shorts. When it trades below spot, shorts pay longs. The rate resets every 8 hours on most exchanges, including Hyperliquid.
Funding rates serve as a crowding indicator. High positive funding means the market is heavily long, and those longs are paying a premium to hold their positions. High negative funding means the market is heavily short. Extreme funding in either direction often precedes reversals, because the cost of holding becomes unsustainable and the crowded side starts to unwind.
What extreme funding looks like: When annualized funding rates exceed 50-100%, the cost of carrying a position becomes a serious drag. A trader holding a $100,000 long at 100% annualized funding is paying roughly $274 per day just to stay in the trade. That cost pressure eventually forces the weakest hands to close, and the resulting unwind can cascade into a sharp price move against the crowded side.
The most powerful funding signals come at extremes. A funding rate z-score (how far the current rate deviates from its historical average) beyond 2.0 in either direction signals dangerous crowding. It doesn’t mean the reversal happens immediately, but it means the market is fragile and a catalyst could trigger a rapid unwind.
Liquidations: Where the Forced Sellers Live
Liquidations are the most violent form of order flow. When a leveraged position moves against a trader far enough to threaten their margin, the exchange forcibly closes the position. That forced closure is a market order, meaning it adds immediate and non-negotiable selling (for long liquidations) or buying (for short liquidations) pressure to the market.
Liquidation cascades are the mechanism behind most sharp price moves in crypto. Price drops to a level where a cluster of long positions gets liquidated. Those liquidations create selling pressure, which pushes price lower, which triggers more liquidations, which creates more selling. The cascade feeds on itself until the cluster is cleared.
Understanding where liquidation clusters sit is critical for order flow analysis. On Hyperliquid, you can map liquidation risk by analyzing the distribution of open positions and their entry prices. Concentrated clusters of leveraged positions at specific price levels act like magnetic zones: price tends to get pulled toward them because the liquidity created by those forced closures is attractive to large traders looking to fill big orders.
Hyperliquid’s Unique Microstructure
Hyperliquid is different from centralized exchanges in ways that matter for order flow analysis. Its L1 blockchain runs a full on-chain order book, which means every order, cancellation, and fill is recorded transparently. This creates a level of data availability that centralized venues cannot match.
Order Priority and Market Maker Protection
One of Hyperliquid’s key microstructure features is how it handles order priority at the consensus level. Cancel and post-only orders are processed before aggressive orders (GTC and IOC). This design choice protects market makers by ensuring they can adjust or remove their liquidity before incoming market orders can pick them off. The result is tighter spreads and deeper books, because market makers can quote more aggressively when they know they have protection against toxic flow.
For order flow analysts, this creates a cleaner signal. The order book on Hyperliquid is less “noisy” than on exchanges where market makers must pad their quotes to account for adverse selection. When you see liquidity sitting at a level on Hyperliquid, it’s more likely to be real rather than phantom liquidity that disappears when tested.
On-Chain Transparency and Cohort Analysis
Because Hyperliquid settles everything on-chain, you can classify wallets by their historical behavior. This is where cohort analysis becomes powerful. Instead of watching aggregate order flow (which blends whale activity with retail noise), you can filter by trader type.
Our data at HyperTracker classifies every wallet on Hyperliquid into 16 behavioral cohorts: 8 based on position size (from Shrimp to Leviathan) and 8 based on all-time profitability (from Rekt to Money Printer). When you see OI rising, you can ask: “Is this the smart money cohort adding longs, or is it retail piling in?” The answer fundamentally changes how you interpret the signal.
- 16 Behavioral Cohorts
- 8 Size-Based Segments
- 8 PnL-Based Segments
- 5 min Refresh Rate
Putting It Together: A Practical Framework
Individual order flow indicators are useful on their own. Combined, they become a decision framework. This is how experienced traders layer these signals on Hyperliquid perps:
Step 1: Check the baseline. What does funding look like? Is the market crowded in one direction? If funding is extreme, you already know the market is fragile. Any catalyst could trigger a reversal.
Step 2: Read the OI trend. Is new money entering or leaving? If OI is rising alongside an extreme funding rate, the crowding is getting worse. If OI is falling, the unwind has already started.
Step 3: Watch CVD for confirmation. Is aggressive buying or selling supporting the current price direction? A move that lacks CVD confirmation is suspect. It’s being driven by positioning mechanics (squeezes, liquidations) rather than genuine conviction.
Step 4: Map the liquidation risk. Where are the clusters? If price is near a large liquidation zone, the probability of a cascade-driven move increases significantly. Knowing where the clusters sit tells you where the magnets are.
Step 5: Filter by cohort. Once you have a directional read from steps 1-4, check who’s driving the flow. If smart money cohorts are aligned with your thesis, the signal is strong. If smart money is positioned opposite to the prevailing trend, be cautious. The sophisticated traders tend to be early, and the crowd tends to be wrong at extremes.
Important caveat: Order flow analysis is a probabilistic framework. It improves your odds of reading the market correctly, but no indicator or combination of indicators works every time. The goal is to make decisions with more information. Perfect information doesn’t exist.
Getting Started with Hyperliquid Order Flow
If you’re new to order flow analysis, start with one indicator and build from there. CVD is the most intuitive starting point because the concept is simple: are buyers or sellers in control? Watch CVD divergences on a 4-hour timeframe for a week and note what happens after each one. You’ll develop an intuition for how the signal plays out on Hyperliquid faster than you think.
For builders and quants who want to go deeper, the HyperTracker API provides programmatic access to the full order flow stack. Cohort analytics, position metrics, funding data, and liquidation risk scoring are all available through a single REST endpoint, with WebSocket and Webhook delivery for streaming updates. Pair that with the dashboard for visual analysis and configurable alerts, and you get full-stack intelligence across every Hyperliquid contract. Instead of building this infrastructure from scratch (which typically runs $10,000+ per month in compute and engineering time), you can query pre-computed intelligence for $179/mo and focus your energy on strategy development.
Order flow analysis on Hyperliquid is still early. The exchange is transparent, the data is accessible, and cohort-level intelligence from HyperTracker lets you see what institutional and whale-class traders are doing in near real-time. More capital is flowing into on-chain perpetuals every month. The window to build this edge before everyone else catches on is closing fast.
Order Flow Analysis 101: Reading Hyperliquid’s Market Microstructure
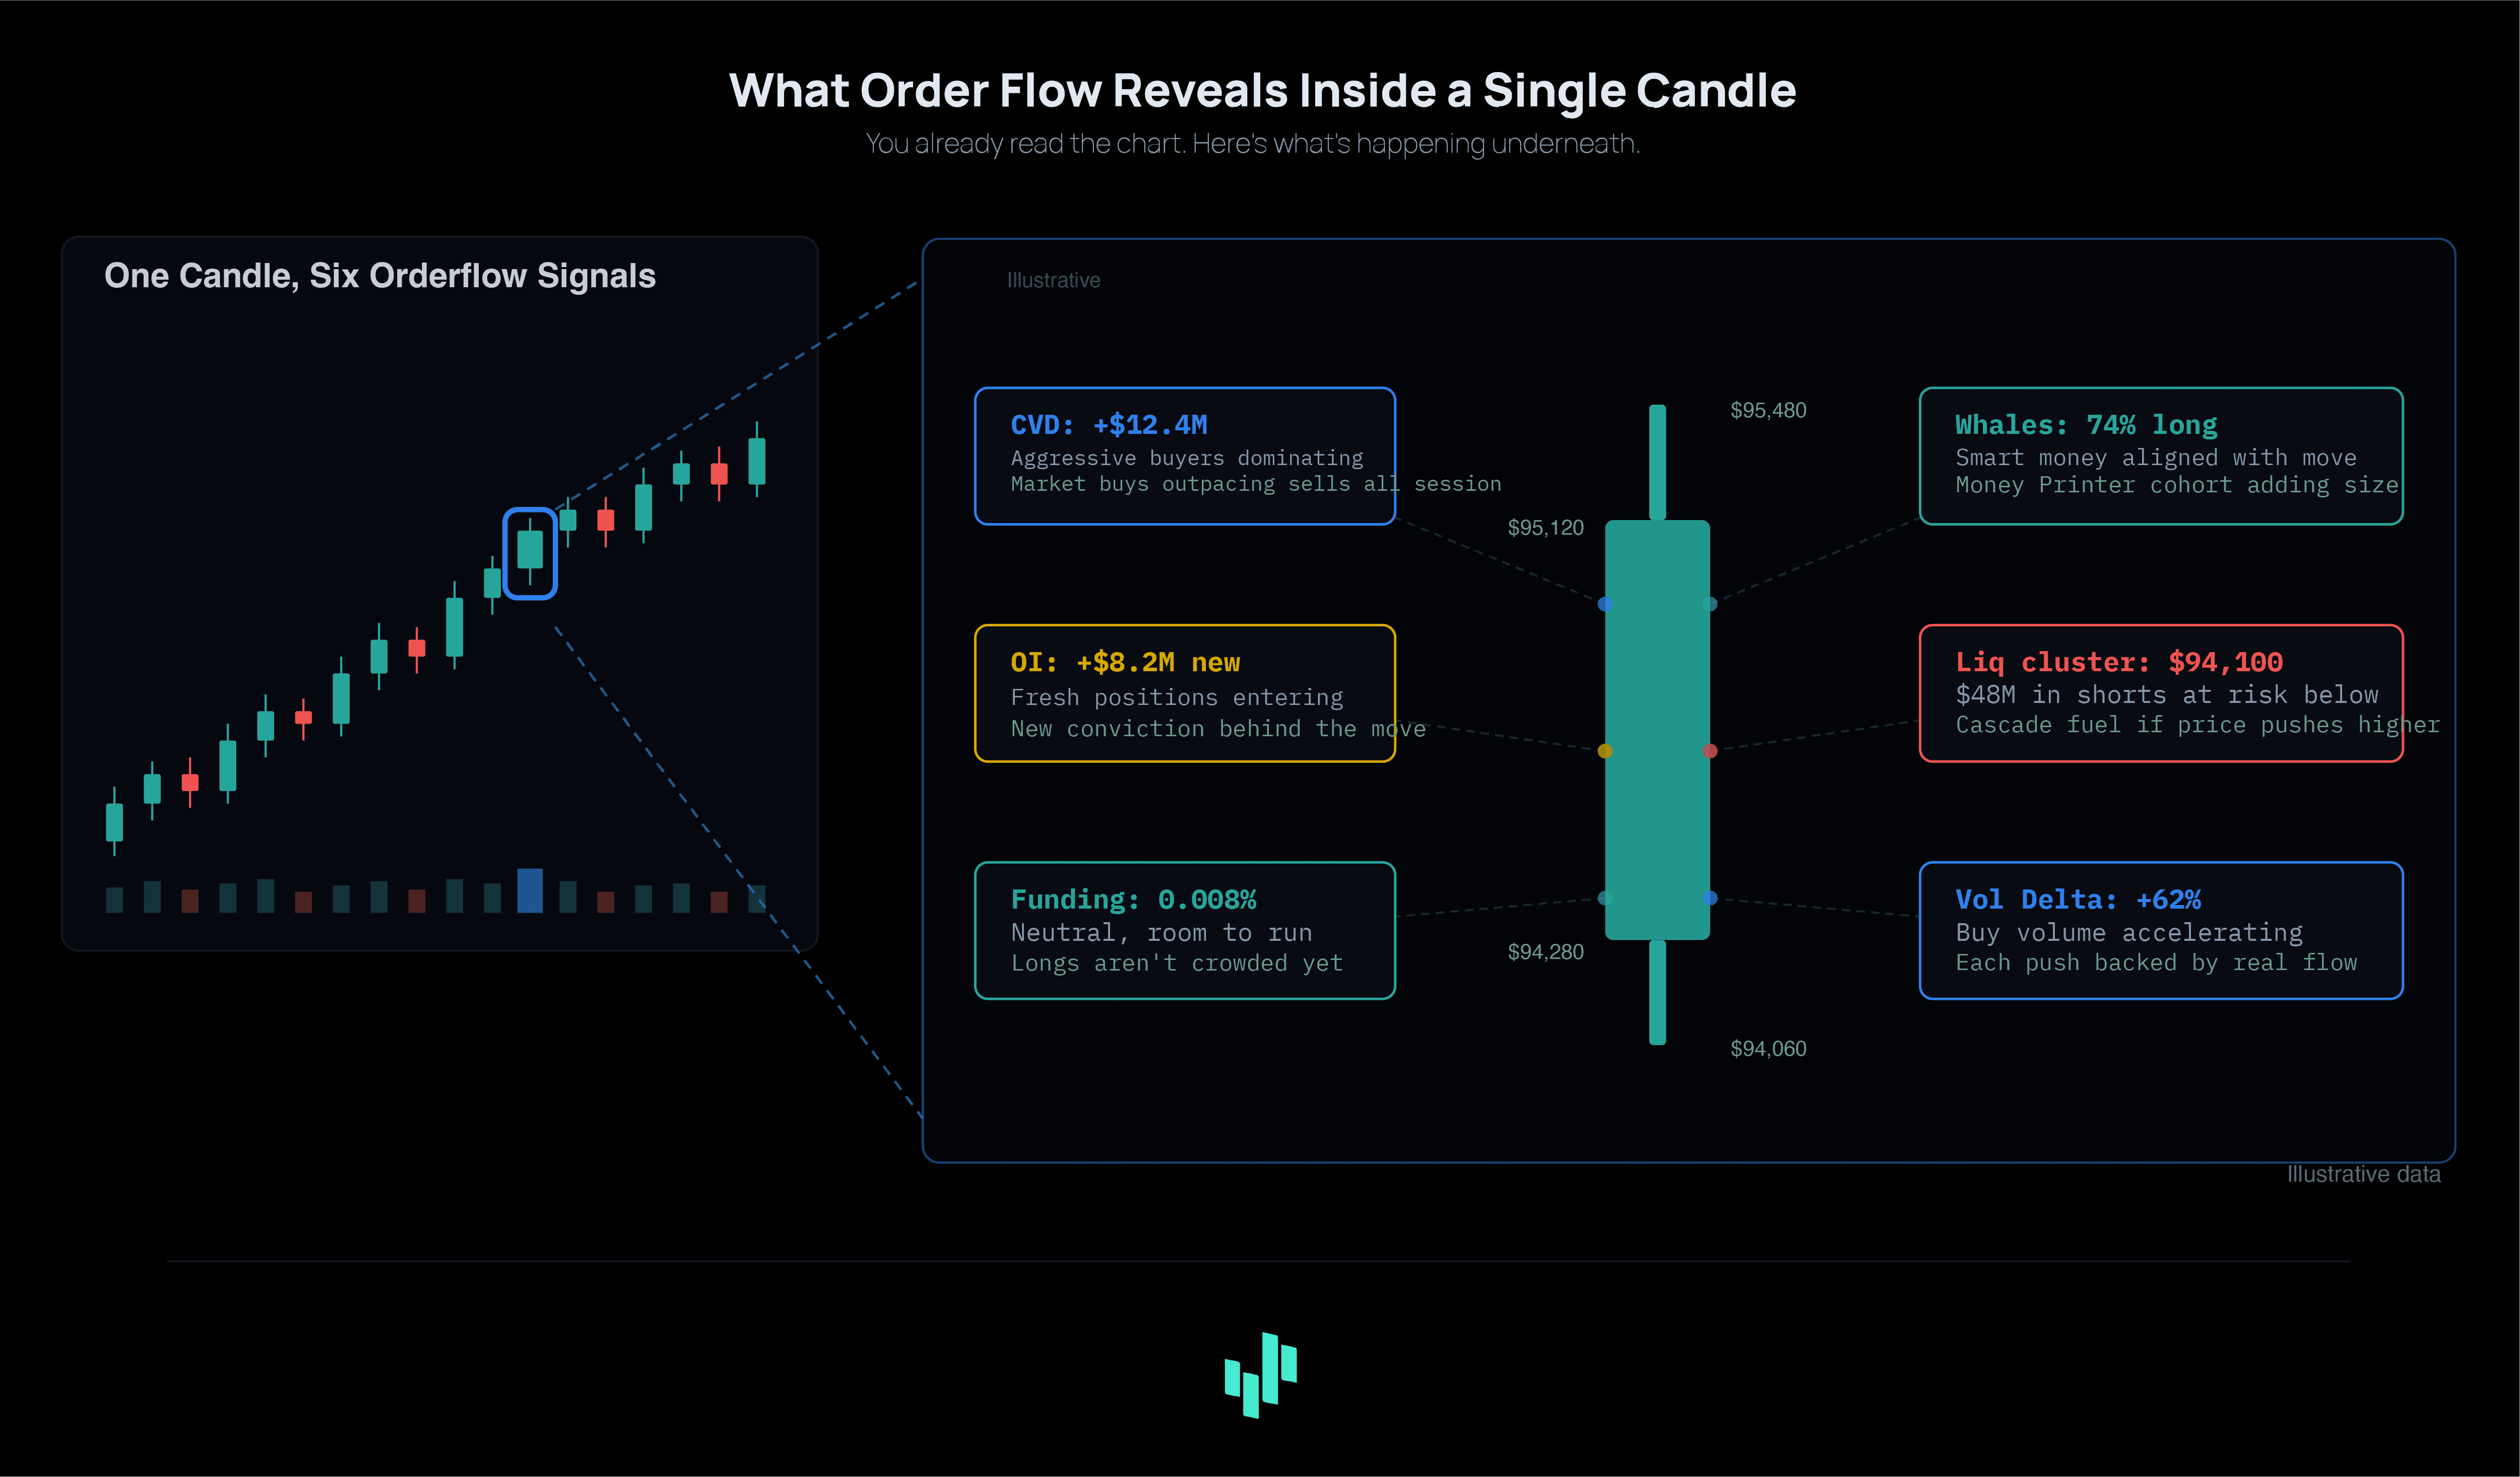
Price charts tell you what happened. Order flow tells you why. If you trade perpetual futures on Hyperliquid and you’re only looking at candles, you’re seeing the aftermath of a battle without knowing who’s fighting.
Order flow analysis strips away the abstraction. Instead of interpreting lagging indicators, you study the raw mechanics of the market: who is buying, who is selling, how aggressive they are, and where the big players are positioned. On a fully on-chain exchange like Hyperliquid, this information is richer than anything available on centralized venues, because every trade, every position, every liquidation lives on a transparent ledger.
This guide covers the core concepts of order flow analysis and shows how they apply to Hyperliquid’s unique market microstructure. Whether you’re building trading bots, managing a quant portfolio, or just trying to stop getting faked out by whale moves, understanding order flow is the foundation.
[IMAGE: anatomy-of-a-price-move.png]
What Is Order Flow Analysis?
Order flow analysis is the study of actual buy and sell orders moving through a market. Traditional technical analysis focuses on price and time. Order flow adds a third dimension: intent. By watching how orders enter the book, execute, and get pulled, you can read the behavior of market participants before price fully reflects their actions.
In traditional finance, order flow analysis has been a staple of institutional trading desks for decades. Futures pit traders in Chicago literally watched the flow of orders come through their booths, reading the urgency and size of each ticket. The digital equivalent replaces the trading pit with data feeds, but the principle is identical: follow the money.
Crypto perpetual futures are particularly suited to order flow analysis for several reasons. They trade 24/7 with no settlement breaks, so the flow never stops. Leverage amplifies positioning signals because traders put up real collateral to express directional views. And on Hyperliquid specifically, every trade settles on-chain, which means the data is verifiable and complete.
The Core Order Flow Indicators
Four indicators form the backbone of order flow analysis in crypto perpetual futures. Each one answers a different question about market behavior, and together they paint a detailed picture of what’s happening beneath the surface of price action.
- CVD — Buying vs. Selling Pressure
- OI — Capital Commitment
- Funding — Directional Crowding
- Liqs — Forced Exits
Cumulative Volume Delta (CVD): The Pressure Gauge
CVD tracks the difference between aggressive buying volume and aggressive selling volume over time. When a trader places a market buy order, that volume gets counted as “buy volume.” Market sells count as “sell volume.” CVD is the running total of that difference.
Why does this matter? Because market orders represent urgency. A limit order sits passively in the book, waiting to get filled. A market order demands immediate execution. When CVD is rising, more traders are aggressively buying than selling. When it’s falling, sellers are in control.
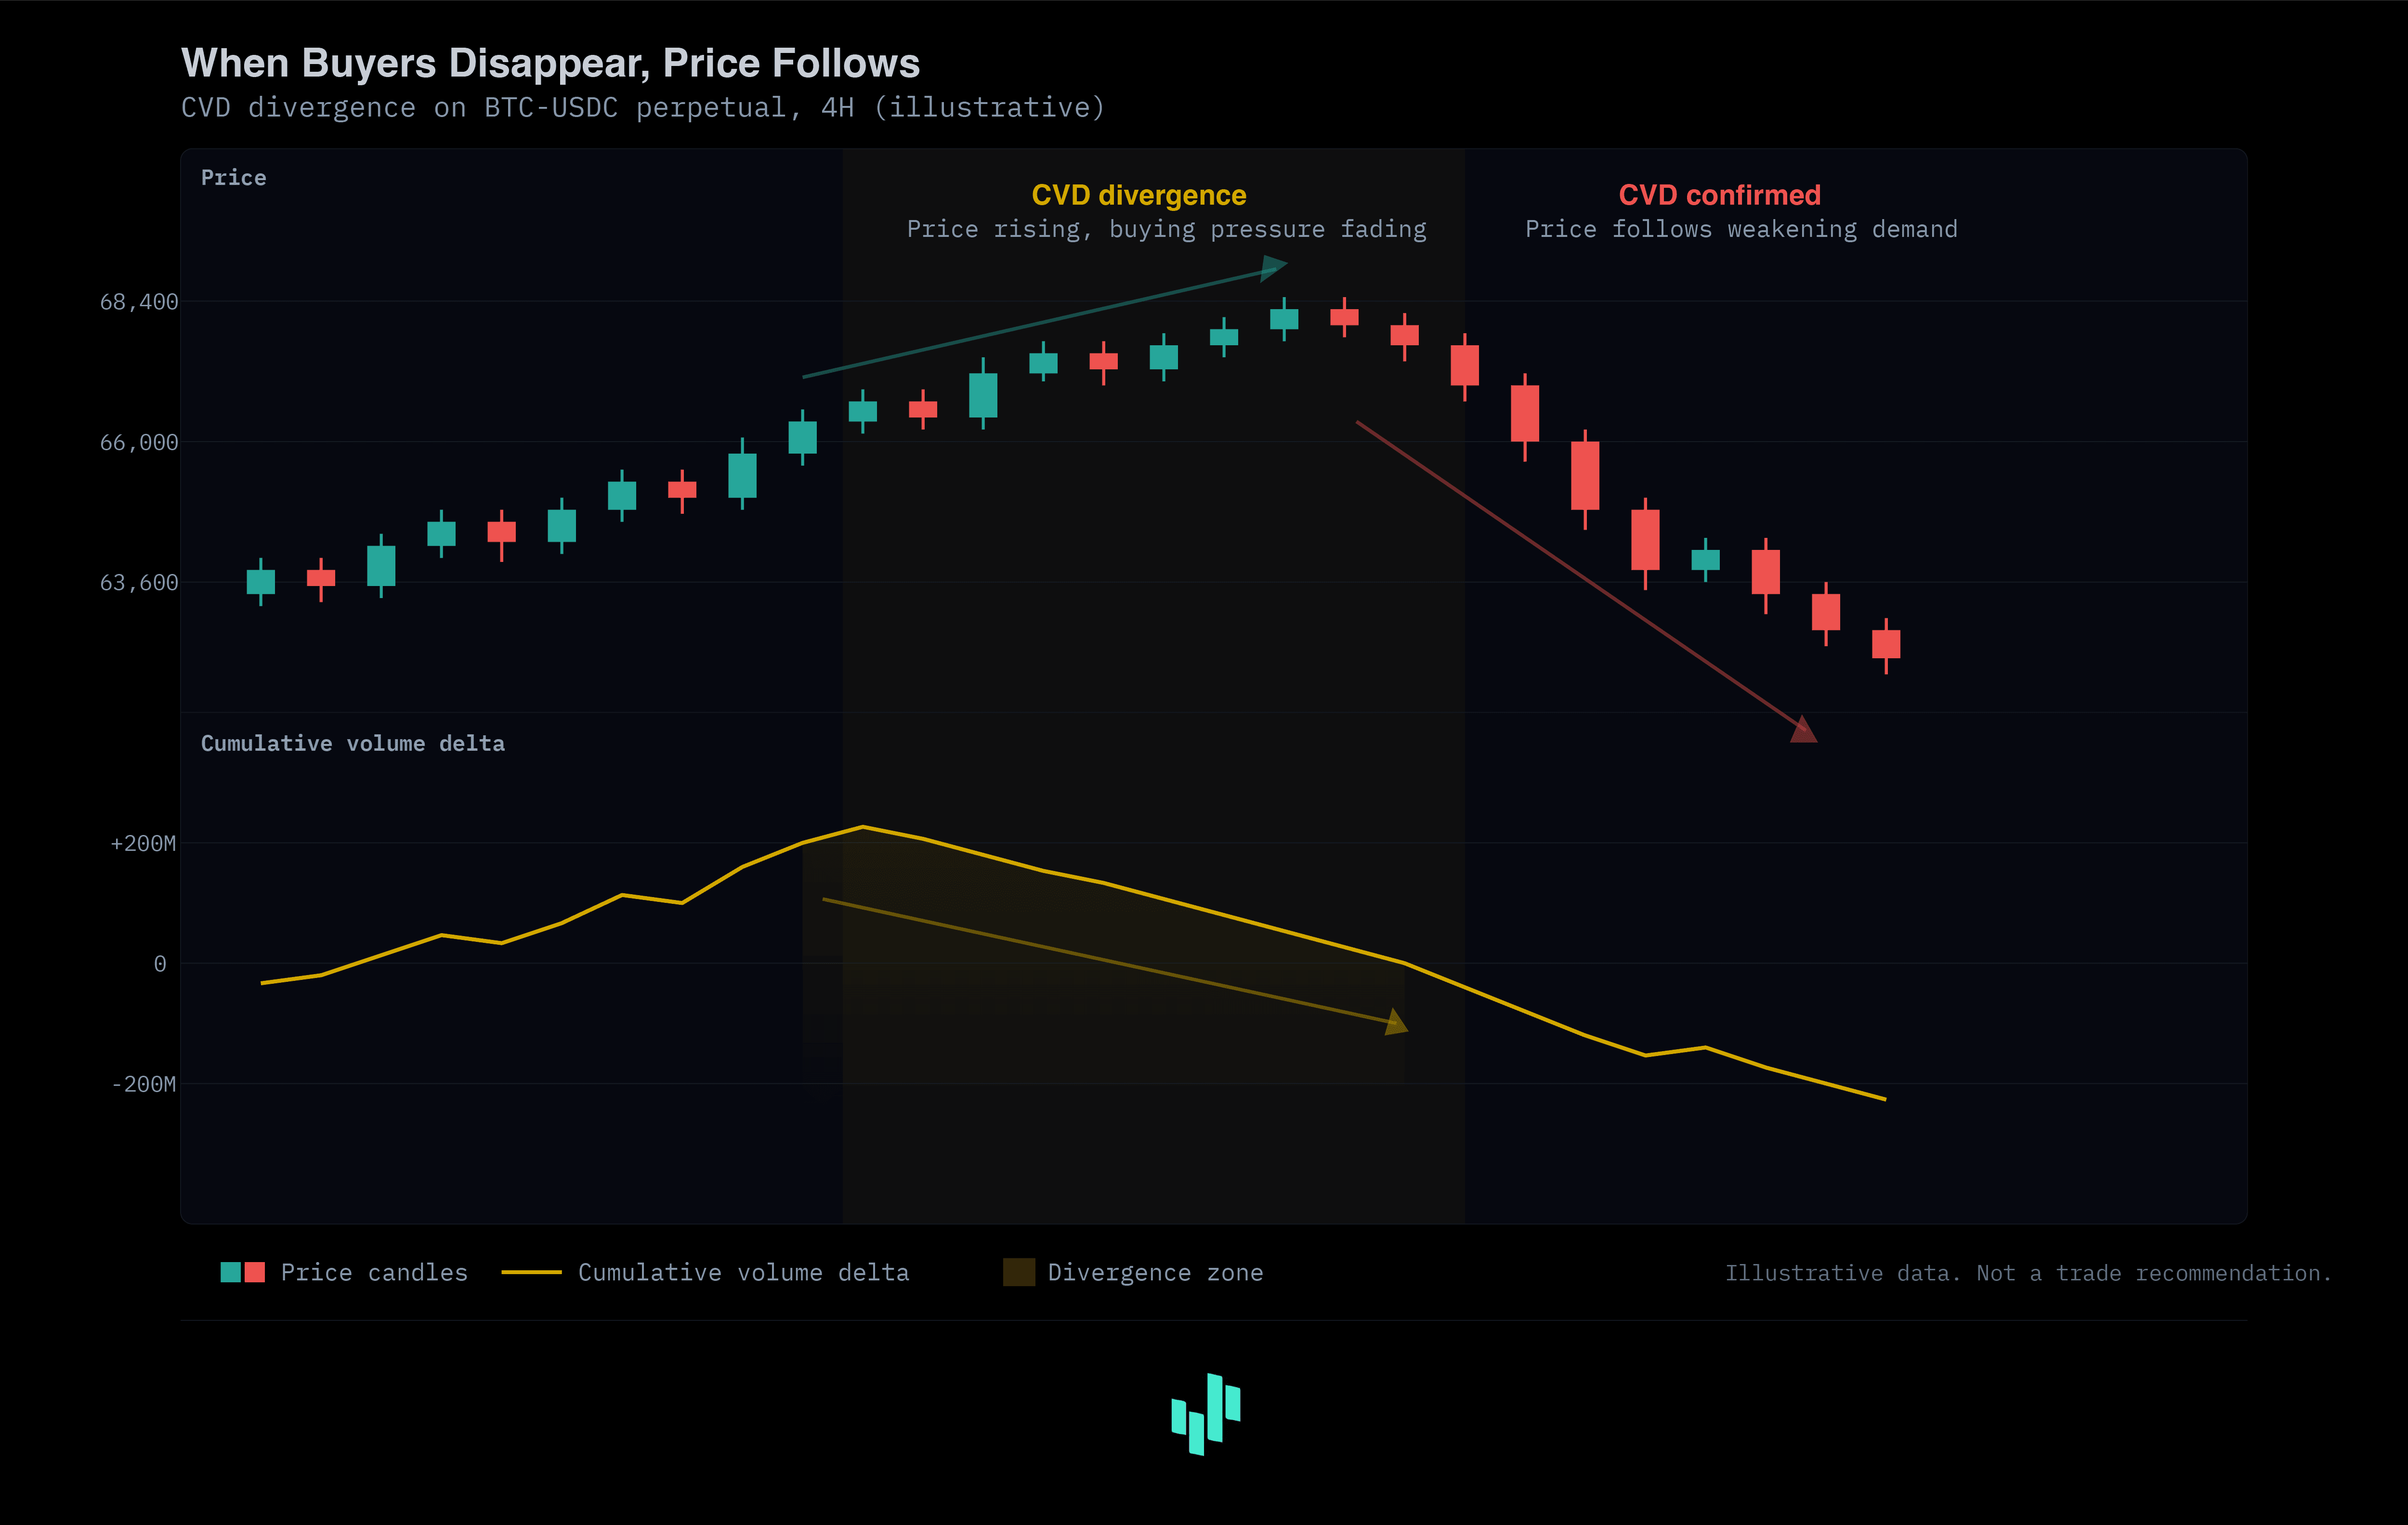
The real power of CVD shows up in divergences. If price is making new highs but CVD is flat or declining, the rally is running on fumes. Buyers aren’t driving price higher with conviction. Instead, price is climbing because sellers are stepping away, which means the advance is fragile. The same logic works in reverse: price making new lows while CVD rises suggests sellers are losing steam and a reversal may be forming.
Practical example: BTC perps on Hyperliquid are trading at $95,000 and pushing toward $96,000. Price ticks up, but CVD over the last 4 hours has been declining. That means market sells are outpacing market buys even as price rises. The move is being driven by thin liquidity above. Genuine buying pressure is absent. This is exactly the kind of setup where price snaps back hard once a real seller shows up.
[IMAGE: cvd-divergence-v2.png]
Open Interest: Following the Money
Open interest (OI) measures the total number of outstanding perpetual futures contracts. Every time a new position opens (a new buyer meets a new seller), OI increases by one contract. When a position closes, OI decreases.
OI tells you whether new money is entering or leaving the market. Rising OI during a price move means conviction: traders are opening fresh positions to bet on the trend continuing. Falling OI during a price move means the opposite: existing positions are being closed, and the move is driven by unwinding rather than new commitment.
Reading OI + Price Together
| Price | Open Interest | Interpretation | | --- | --- | --- | | Rising | Rising | Strong uptrend. New longs entering. Bullish conviction. | | Rising | Falling | Short squeeze. Shorts are closing. New longs are absent. Fragile. | | Falling | Rising | Strong downtrend. New shorts entering. Bearish conviction. | | Falling | Falling | Long liquidation. Longs are exiting. Fresh shorts are absent. Could be near a bottom. |
On Hyperliquid, OI data is particularly valuable because you can see it broken down by the type of trader. Through cohort analytics, you can distinguish whether OI growth is coming from large experienced traders (“smart money”) or smaller retail participants. That distinction changes the interpretation entirely: rising OI from whale-class accounts carries far more weight than the same OI increase from smaller traders.
Funding Rates: Who’s Crowded
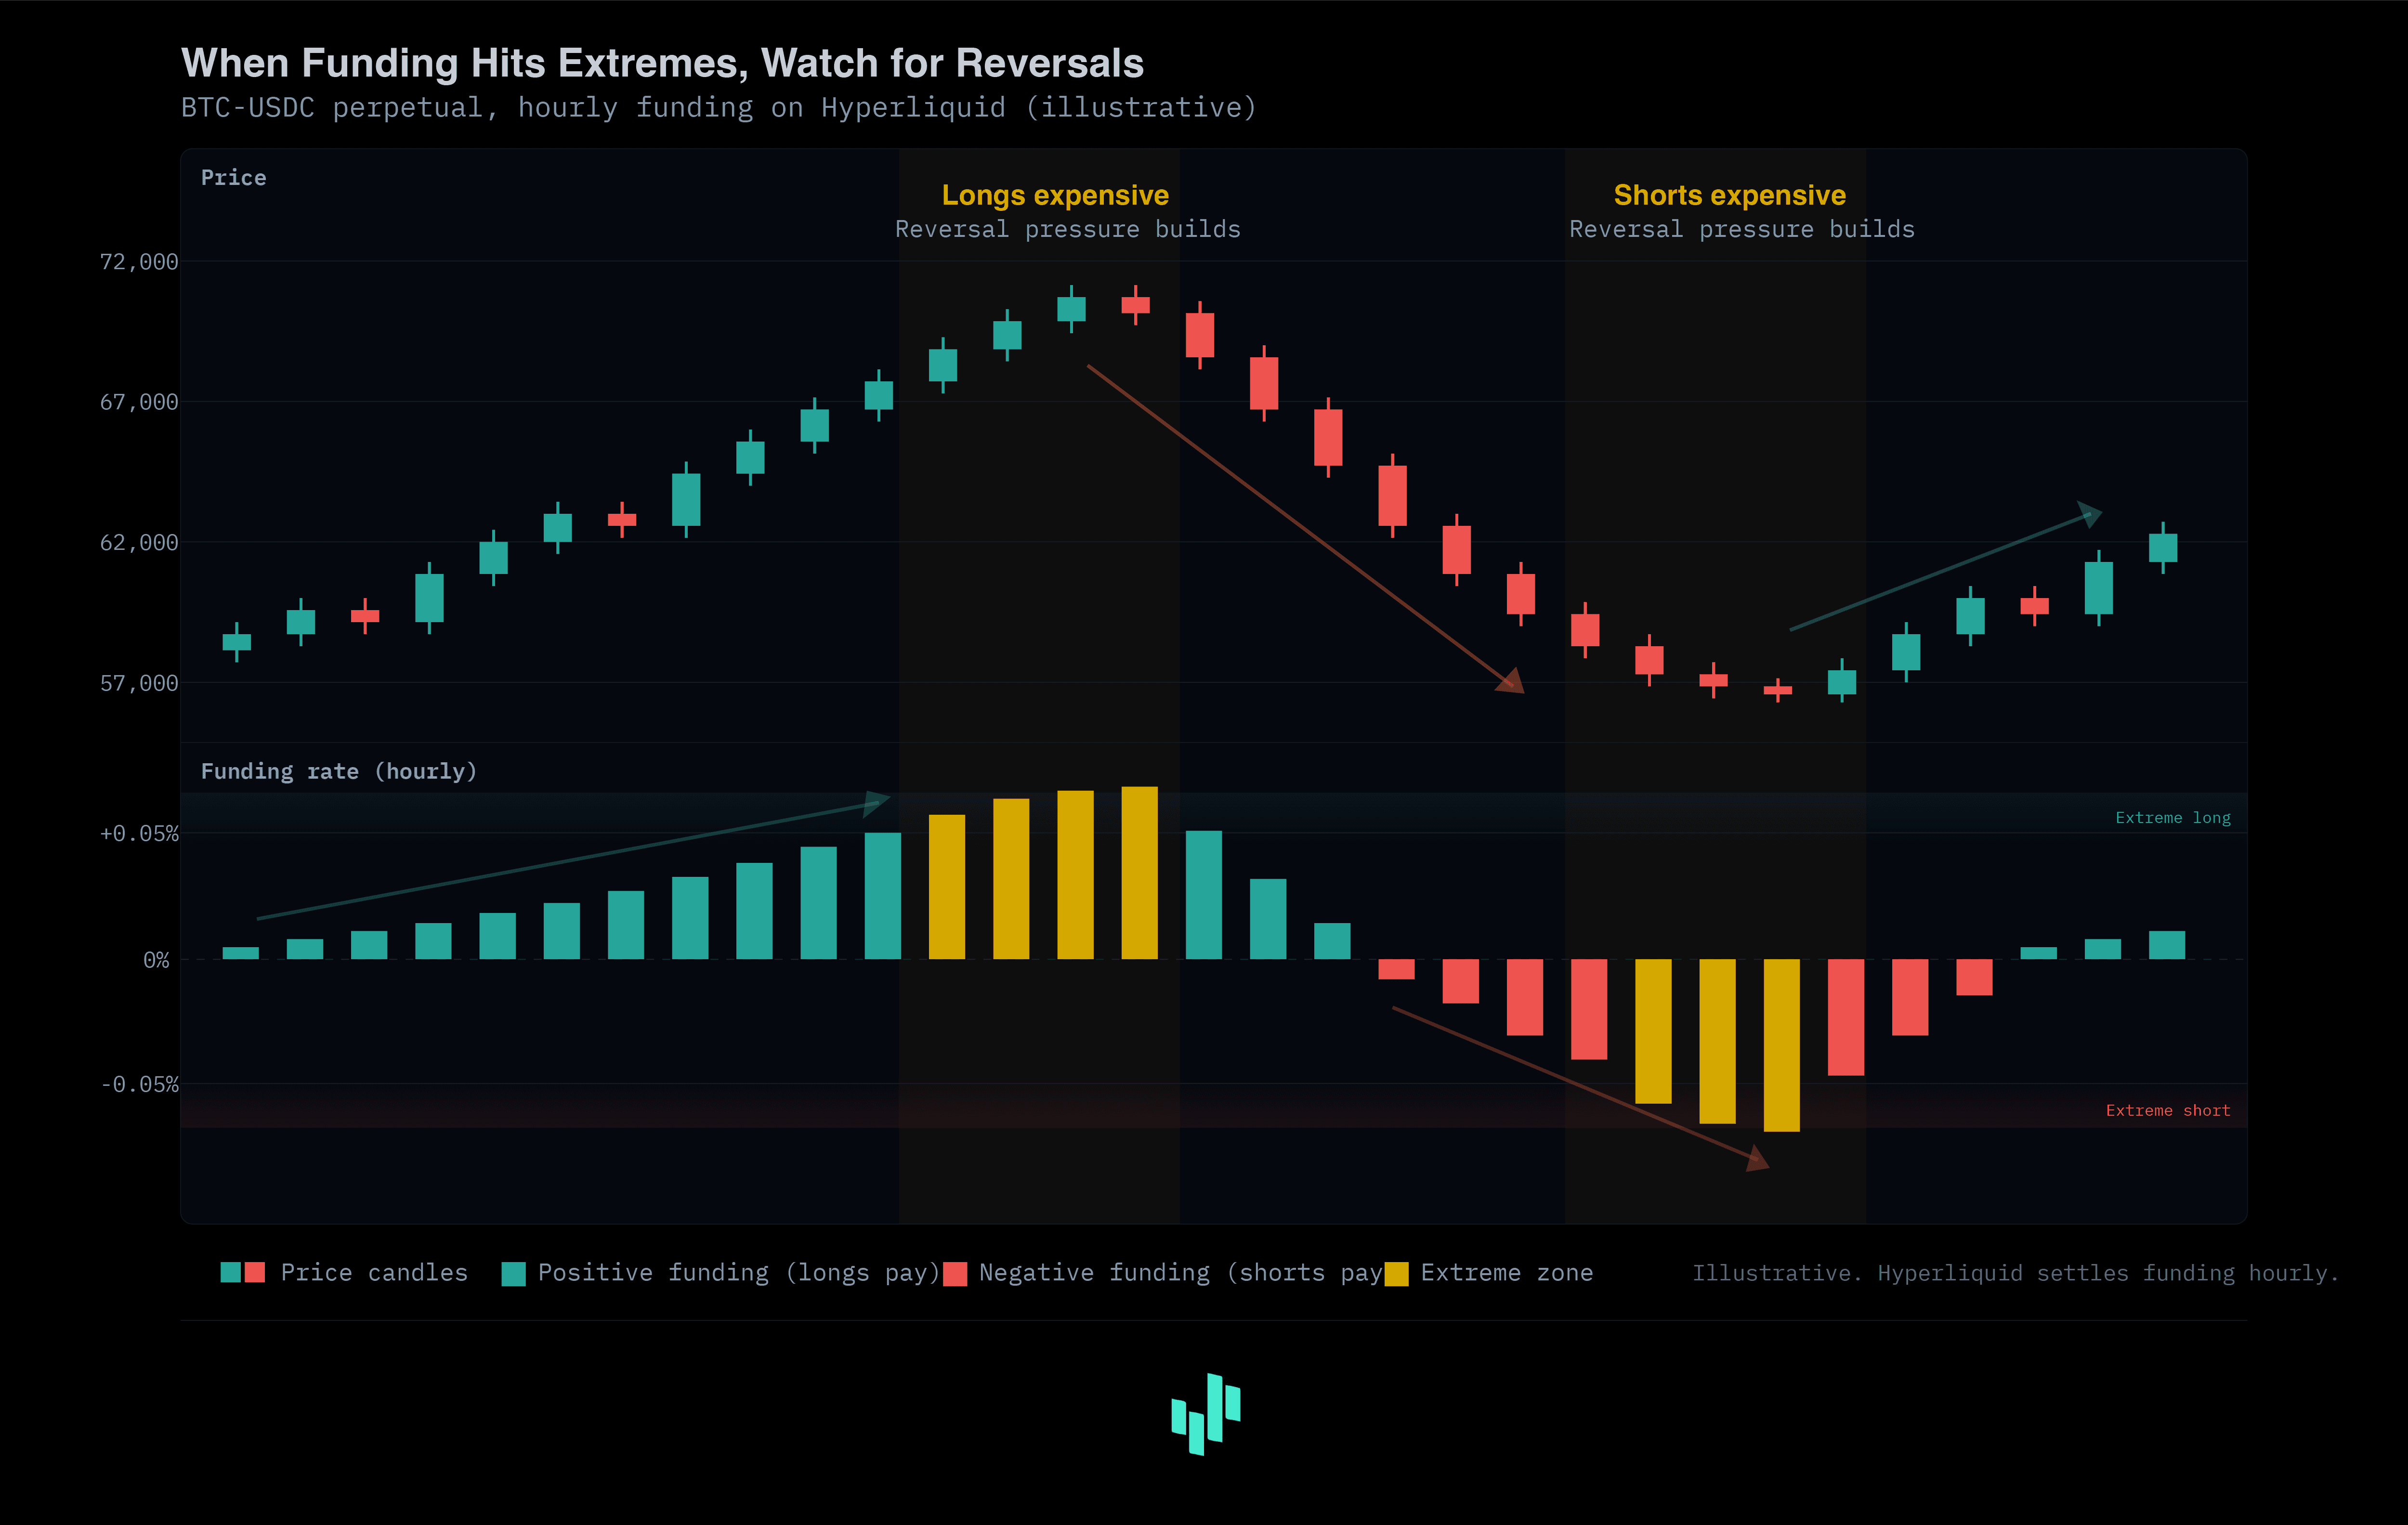
Perpetual futures don’t expire, so they use a funding rate mechanism to keep the contract price anchored to the spot price. When the perp trades above spot (long-heavy market), longs pay shorts. When it trades below spot, shorts pay longs. The rate resets every 8 hours on most exchanges, including Hyperliquid.
Funding rates serve as a crowding indicator. High positive funding means the market is heavily long, and those longs are paying a premium to hold their positions. High negative funding means the market is heavily short. Extreme funding in either direction often precedes reversals, because the cost of holding becomes unsustainable and the crowded side starts to unwind.
What extreme funding looks like: When annualized funding rates exceed 50-100%, the cost of carrying a position becomes a serious drag. A trader holding a $100,000 long at 100% annualized funding is paying roughly $274 per day just to stay in the trade. That cost pressure eventually forces the weakest hands to close, and the resulting unwind can cascade into a sharp price move against the crowded side.
The most powerful funding signals come at extremes. A funding rate z-score (how far the current rate deviates from its historical average) beyond 2.0 in either direction signals dangerous crowding. It doesn’t mean the reversal happens immediately, but it means the market is fragile and a catalyst could trigger a rapid unwind.
[IMAGE: funding-rate-v2.png]
Liquidations: Where the Forced Sellers Live
Liquidations are the most violent form of order flow. When a leveraged position moves against a trader far enough to threaten their margin, the exchange forcibly closes the position. That forced closure is a market order, meaning it adds immediate and non-negotiable selling (for long liquidations) or buying (for short liquidations) pressure to the market.
Liquidation cascades are the mechanism behind most sharp price moves in crypto. Price drops to a level where a cluster of long positions gets liquidated. Those liquidations create selling pressure, which pushes price lower, which triggers more liquidations, which creates more selling. The cascade feeds on itself until the cluster is cleared.
Understanding where liquidation clusters sit is critical for order flow analysis. On Hyperliquid, you can map liquidation risk by analyzing the distribution of open positions and their entry prices. Concentrated clusters of leveraged positions at specific price levels act like magnetic zones: price tends to get pulled toward them because the liquidity created by those forced closures is attractive to large traders looking to fill big orders.
Hyperliquid’s Unique Microstructure
Hyperliquid is different from centralized exchanges in ways that matter for order flow analysis. Its L1 blockchain runs a full on-chain order book, which means every order, cancellation, and fill is recorded transparently. This creates a level of data availability that centralized venues cannot match.
Order Priority and Market Maker Protection
One of Hyperliquid’s key microstructure features is how it handles order priority at the consensus level. Cancel and post-only orders are processed before aggressive orders (GTC and IOC). This design choice protects market makers by ensuring they can adjust or remove their liquidity before incoming market orders can pick them off. The result is tighter spreads and deeper books, because market makers can quote more aggressively when they know they have protection against toxic flow.
For order flow analysts, this creates a cleaner signal. The order book on Hyperliquid is less “noisy” than on exchanges where market makers must pad their quotes to account for adverse selection. When you see liquidity sitting at a level on Hyperliquid, it’s more likely to be real rather than phantom liquidity that disappears when tested.
On-Chain Transparency and Cohort Analysis
Because Hyperliquid settles everything on-chain, you can classify wallets by their historical behavior. This is where cohort analysis becomes powerful. Instead of watching aggregate order flow (which blends whale activity with retail noise), you can filter by trader type.
Our data at HyperTracker classifies every wallet on Hyperliquid into 16 behavioral cohorts: 8 based on position size (from Shrimp to Leviathan) and 8 based on all-time profitability (from Rekt to Money Printer). When you see OI rising, you can ask: “Is this the smart money cohort adding longs, or is it retail piling in?” The answer fundamentally changes how you interpret the signal.
- 16 Behavioral Cohorts
- 8 Size-Based Segments
- 8 PnL-Based Segments
- 5 min Refresh Rate
Putting It Together: A Practical Framework
Individual order flow indicators are useful on their own. Combined, they become a decision framework. This is how experienced traders layer these signals on Hyperliquid perps:
Step 1: Check the baseline. What does funding look like? Is the market crowded in one direction? If funding is extreme, you already know the market is fragile. Any catalyst could trigger a reversal.
Step 2: Read the OI trend. Is new money entering or leaving? If OI is rising alongside an extreme funding rate, the crowding is getting worse. If OI is falling, the unwind has already started.
Step 3: Watch CVD for confirmation. Is aggressive buying or selling supporting the current price direction? A move that lacks CVD confirmation is suspect. It’s being driven by positioning mechanics (squeezes, liquidations) rather than genuine conviction.
Step 4: Map the liquidation risk. Where are the clusters? If price is near a large liquidation zone, the probability of a cascade-driven move increases significantly. Knowing where the clusters sit tells you where the magnets are.
Step 5: Filter by cohort. Once you have a directional read from steps 1-4, check who’s driving the flow. If smart money cohorts are aligned with your thesis, the signal is strong. If smart money is positioned opposite to the prevailing trend, be cautious. The sophisticated traders tend to be early, and the crowd tends to be wrong at extremes.
Important caveat: Order flow analysis is a probabilistic framework. It improves your odds of reading the market correctly, but no indicator or combination of indicators works every time. The goal is to make decisions with more information. Perfect information doesn’t exist.
Getting Started with Hyperliquid Order Flow
If you’re new to order flow analysis, start with one indicator and build from there. CVD is the most intuitive starting point because the concept is simple: are buyers or sellers in control? Watch CVD divergences on a 4-hour timeframe for a week and note what happens after each one. You’ll develop an intuition for how the signal plays out on Hyperliquid faster than you think.
For builders and quants who want to go deeper, the HyperTracker API provides programmatic access to the full order flow stack. Cohort analytics, position metrics, funding data, and liquidation risk scoring are all available through a single REST endpoint, with WebSocket and Webhook delivery for streaming updates. Pair that with the dashboard for visual analysis and configurable alerts, and you get full-stack intelligence across every Hyperliquid contract. Instead of building this infrastructure from scratch (which typically runs $10,000+ per month in compute and engineering time), you can query pre-computed intelligence for $179/mo and focus your energy on strategy development.
Order flow analysis on Hyperliquid is still early. The exchange is transparent, the data is accessible, and cohort-level intelligence from HyperTracker lets you see what institutional and whale-class traders are doing in near real-time. More capital is flowing into on-chain perpetuals every month. The window to build this edge before everyone else catches on is closing fast.
In markets, information is the only real advantage. Order flow is how you get it first.