
How To Use Volume Profile for Smarter Trading
By Dead Cat Bounce - 20-Jul-2025
There are times when trading can feel like flying blind. Price stalls at a random level or chops around a breakout, and you’re left unsure of what to do next. But what if you had X-ray vision for the markets?
That’s where Volume Profile comes in. A tool that reveals where meaningful trading activity has actually taken place. Let’s break down what it is and how to use it to sharpen your edge.
What Is Volume Profile?
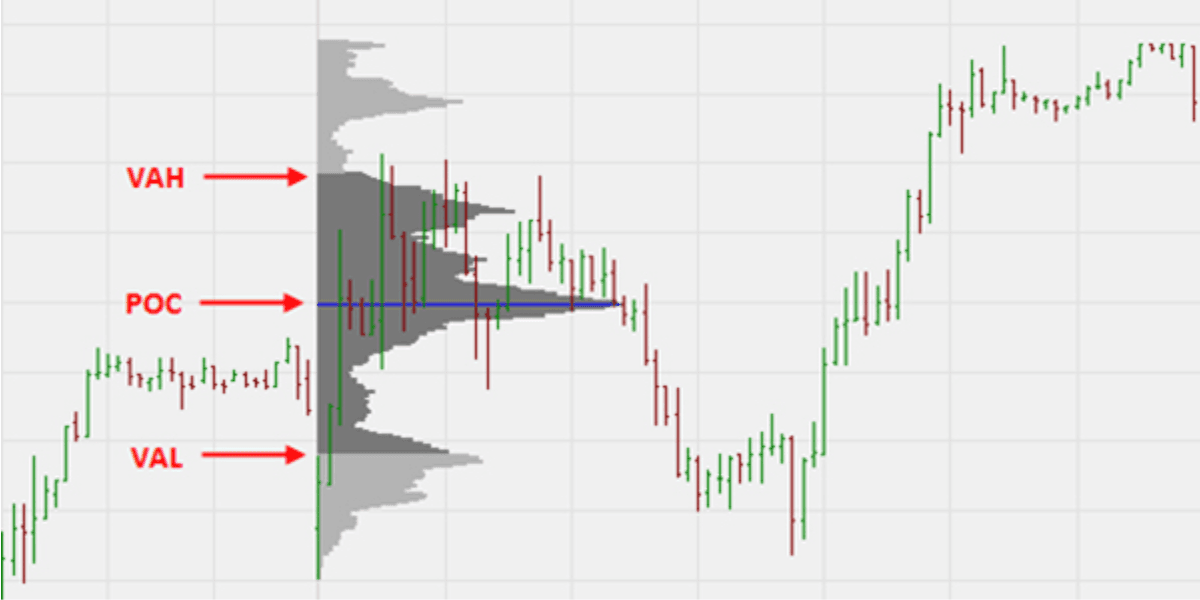
Volume Profile is a visual map of where the market traded most heavily. Not over time, but by price level. Unlike the volume bars at the bottom of your chart (which show volume by time), Volume Profile displays a horizontal histogram along the side of the chart. It reveals where the real battles happened between buyers and sellers.
Key Terms to Know:
POC (Point of Control):
The price level with the highest traded volume. Think of it as the market’s “home base”. Prices often return here to test demand.
Value Area (VA):
The zone where around 70% of volume occurred. This is considered the “fair value” where most buyers and sellers agreed on price.
High-Volume Nodes (HVNs):
Price levels with heavy trading activity. These act like brick walls. Prices often stall or reverse here.
Low-Volume Nodes (LVNs):
Thinly traded areas. Price tends to move quickly through these zones.
Why It Matters
Most traders rely on trendlines or patterns without knowing why price respects certain levels. Volume Profile helps you see where smart money stepped in, and where they're likely to defend positions.
HVNs = defence zones (mean reversion, traps)
LVNs = momentum zones (clean moves, quick breaks)
Knowing these areas in advance can help you spot reversals, breakouts, and fakeouts before they play out.
My Playbook for Trading With Volume Profile
1. Finding Setups
HVN Reversal Entry
When price hits an HVN and gets rejected (e.g. pin bar, engulfing candle), I lean towards a reversal. Stops go above the HVN or rejection candle.
POC Retest
When price returns to the POC after a move:
In ranges → I tend to fade it with confirmation.
In trends → I look to buy/long it. These often offer the only pullback opportunity in strong moves.
2. Confirming Trades
LVN Break
After I’ve entered a trade, a strong push through an LVN confirms momentum and lets me ride the move to the next HVN or POC.
Common Mistakes to Avoid
Overcomplicating Things
Don’t apply Volume Profile to every timeframe. It becomes noisy.
Use one for bias (e.g. Daily) and one for entries (e.g. 1H or 15min).
Ignoring the Trend
In strong trends, HVNs often hold. Always check the higher timeframe first and manage your risk accordingly.
Forcing Trades
Not every level is a setup. Be patient. Wait for your trigger and price action confirmation.

Final Thoughts
Volume Profile is your window into the market’s real activity. Not just price, but interest. It works across styles, from scalping to swing trading. But like any tool, it works best when combined with solid price action and clear risk management.
Start testing it out, and watch how it sharpens your edge.
Good luck, and trade smart.