
Every Wallet Has a Lean: How to Query Cohort Bias on Hyperliquid
By CMM Team - 09-Jul-2026
Every Wallet Has a Lean: How to Query Cohort Bias on Hyperliquid
Every wallet on Hyperliquid is leaning somewhere. Some are net long, some are net short, and the aggregate direction of those leans across thousands of wallets tells you something that no candlestick chart can. The question is whether you're reading it, and whether you're reading it by cohort.
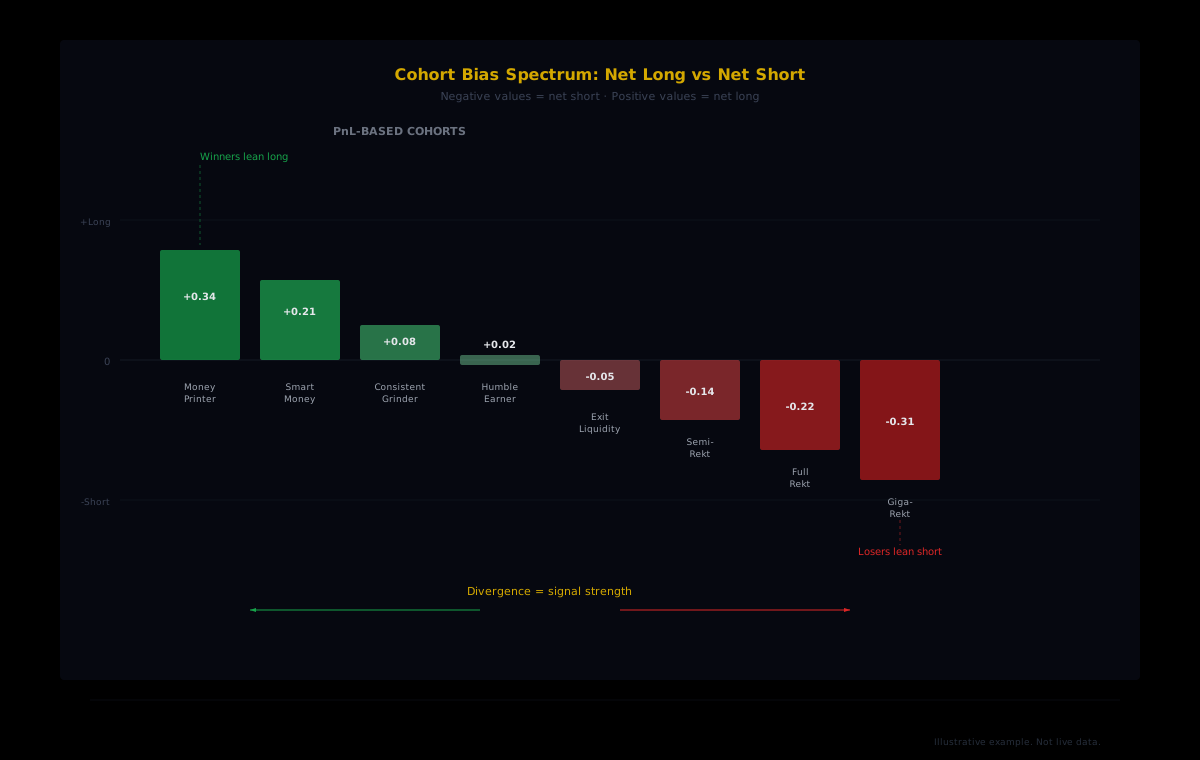
HyperTracker classifies every active wallet into one of 16 behavioral cohorts, 8 by account size (Shrimp through Leviathan) and 8 by all-time PnL (Money Printer through Giga-Rekt). Each cohort carries a bias score: a single number that tells you whether that group of traders is collectively positioned long or short. When the Money Printers are leaning one way and the Giga-Rekts are leaning the other, you have a divergence signal that's worth paying attention to. This guide shows you how to query it, interpret it, and build on it.
What Cohort Bias Actually Measures
Bias is a normalized score. Negative means the cohort is net short. Positive means net long. Zero means the aggregate positioning is balanced. The score isn't a dollar amount or a percentage of open interest. It's a directional reading that captures the lean of every wallet classified into that segment.
Think of it like a tilt meter on a building. The building is all wallets in a cohort. If 70% of the capital is deployed long, the meter tilts positive. If most wallets are short, it tilts negative. The magnitude tells you how strong the lean is, and the change over time tells you whether conviction is building or fading.
Key distinction: Bias measures aggregate directional lean across all wallets in a cohort. It does not tell you what any single wallet is doing. It tells you what the group is doing, which is the signal that matters for market structure analysis.
This matters because individual wallets lie. A single wallet can be hedging, running a basis trade, or parking capital in a direction that doesn't reflect conviction. But when hundreds of wallets classified as Money Printers (all-time PnL above $1M) are collectively leaning long, that's a pattern, not an accident.
Three Endpoints, Three Views of the Same Question
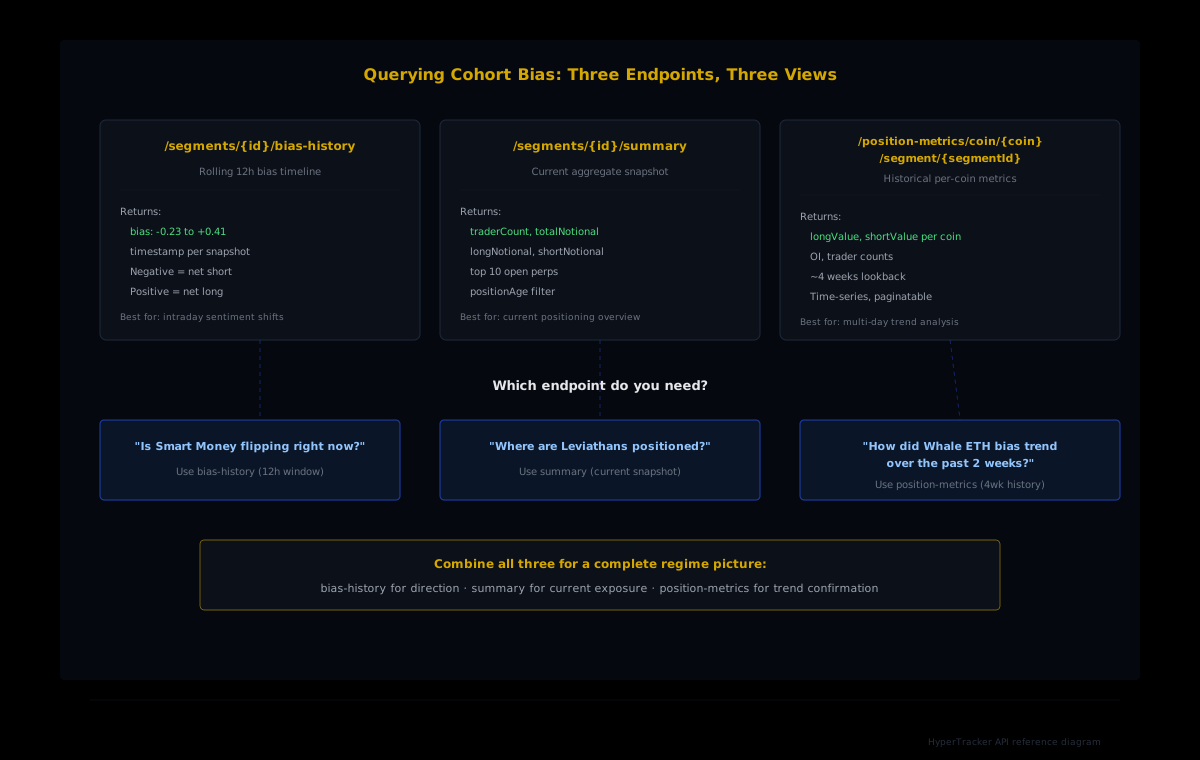
The HyperTracker API exposes cohort bias through three related endpoints. Each one answers a slightly different version of the same question: where is this cohort leaning?
1. Bias History (Rolling 12-Hour Window)
The /segments/{segmentId}/bias-history endpoint returns a time series of bias values over a rolling 12-hour window. Each data point is a snapshot of the cohort's aggregate lean at that moment.
import requests

BASE_URL = "https://ht-api.coinmarketman.com/api/external"
HEADERS = {"Authorization": "Bearer YOUR_API_KEY"}

def fetch_bias_history(segment_id, recency="all"):
    resp = requests.get(
        f"{BASE_URL}/segments/{segment_id}/bias-history",
        headers=HEADERS,
        params={"positionRecencyTimeframe": recency}
    )
    resp.raise_for_status()
    return resp.json()

# Money Printer bias over the last 12 hours
bias = fetch_bias_history(segment_id=8)
for point in bias[:5]:
    print(f"{point['timestamp']}: {point['bias']}")
The positionRecencyTimeframe parameter filters by position age: 24h, 7d, 30d, or all (default). Setting it to 24h shows bias from only recently opened positions, which isolates fresh conviction from legacy positions that may have been open for weeks.
Lookback limit: This endpoint returns a rolling 12-hour window. It is designed for intraday sentiment analysis, not multi-day backtesting. If you need historical trend data, use the position-metrics endpoint instead (covered below).
2. Segment Summary (Current Snapshot)
The /segments/{segmentId}/summary endpoint gives you the current aggregate state of a cohort: how many traders, total notional exposure, long vs short breakdown, and the top 10 open positions.
def fetch_segment_summary(segment_id, position_age="all"):
    resp = requests.get(
        f"{BASE_URL}/segments/{segment_id}/summary",
        headers=HEADERS,
        params={"positionAge": position_age}
    )
    resp.raise_for_status()
    return resp.json()

# Leviathan summary ($5M+ wallets)
summary = fetch_segment_summary(segment_id=7)
print(f"Traders: {summary['traderCount']}")
print(f"Long: ${summary['longNotional']:,.0f}")
print(f"Short: ${summary['shortNotional']:,.0f}")
print(f"Bias: {'LONG' if summary['longNotional'] > summary['shortNotional'] else 'SHORT'}")
This endpoint doesn't give you a time series. It's a single point-in-time snapshot. The value is in the raw numbers: you can compute your own long/short ratio, compare it across cohorts, and see exactly which assets the top 10 positions are concentrated in. The positionAge filter works the same way as the bias endpoint, letting you isolate fresh activity.
3. Position Metrics by Coin and Segment (Multi-Week History)
The /position-metrics/coin/{coin}/segment/{segmentId} endpoint is the one you use for trend analysis. It returns historical long/short values, OI, and trader counts for a specific coin and cohort combination, going back approximately 4 weeks.
from datetime import datetime, timedelta

def fetch_cohort_position_metrics(coin, segment_id, days_back=14):
    start = (datetime.utcnow() - timedelta(days=days_back)).strftime(
        "%Y-%m-%dT00:00:00.000Z"
    )
    resp = requests.get(
        f"{BASE_URL}/position-metrics/coin/{coin}/segment/{segment_id}",
        headers=HEADERS,
        params={"start": start}
    )
    resp.raise_for_status()
    return resp.json()

# Smart Money BTC positioning over the last 14 days
metrics = fetch_cohort_position_metrics("BTC", segment_id=9, days_back=14)
for entry in metrics[:3]:
    long_pct = entry["longValue"] / max(entry["longValue"] + entry["shortValue"], 1)
    print(f"{entry['timestamp']}: {long_pct:.1%} long")
This endpoint requires a start parameter in ISO 8601 format. The maximum lookback is approximately 4 weeks. Beyond that, data is not available. For longer historical analysis, use the individual positions endpoint (/positions), which goes back roughly 10 months.
Building a Cohort Divergence Dashboard
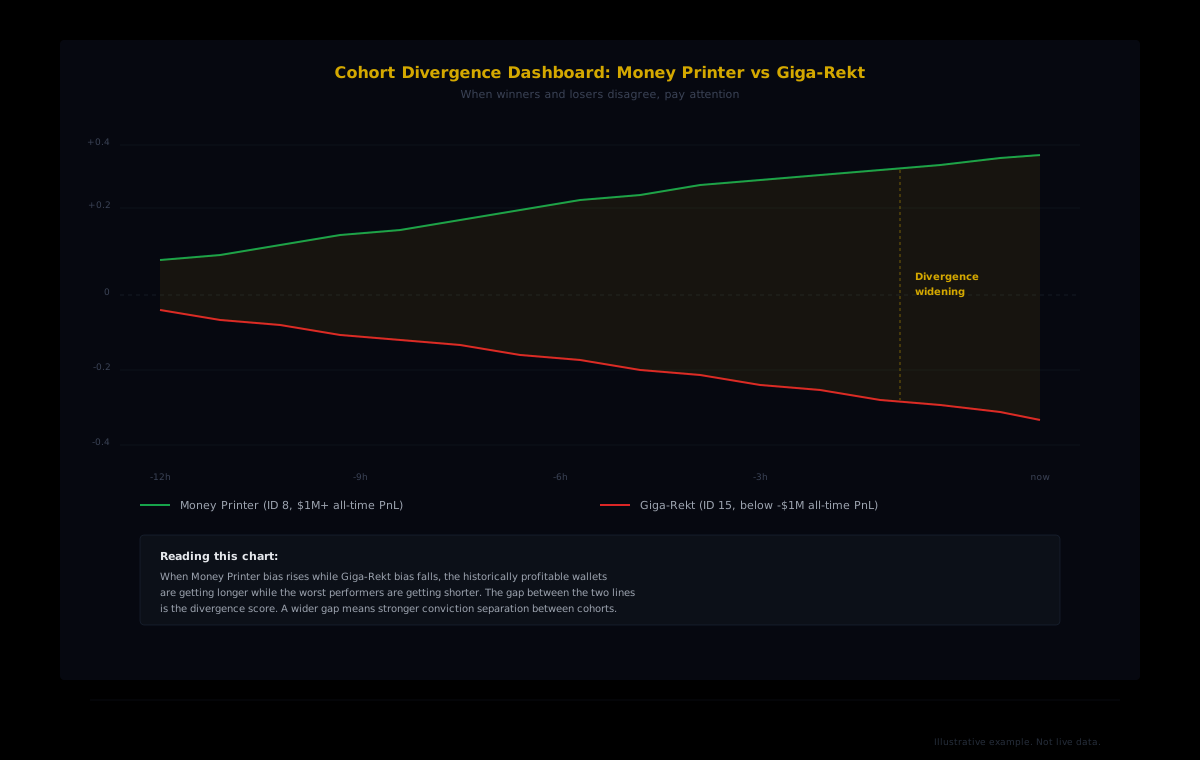
The most actionable signal from cohort bias isn't any single cohort's lean. It's the gap between two cohorts. When the Money Printer cohort (segment ID 8) is positioned long and the Giga-Rekt cohort (segment ID 15) is positioned short, that divergence tells you something about the market that aggregate OI or funding rates alone cannot.
Here's a script that polls both cohorts and computes a divergence score:
import time

def compute_divergence():
    mp_bias = fetch_bias_history(segment_id=8)  # Money Printer
    gr_bias = fetch_bias_history(segment_id=15)  # Giga-Rekt

    if not mp_bias or not gr_bias:
        return None

    # Most recent bias value for each
    mp_latest = mp_bias[0]["bias"]
    gr_latest = gr_bias[0]["bias"]

    divergence = mp_latest - gr_latest

    return {
        "money_printer_bias": mp_latest,
        "giga_rekt_bias": gr_latest,
        "divergence": round(divergence, 4),
        "interpretation": interpret_divergence(divergence)
    }

def interpret_divergence(div):
    # Example thresholds — calibrate based on your own backtesting
    if div > 0.3:
        return "Strong bullish divergence: winners long, losers short"
    elif div > 0.15:
        return "Moderate bullish divergence"
    elif div < -0.3:
        return "Strong bearish divergence: winners short, losers long"
    elif div < -0.15:
        return "Moderate bearish divergence"
    return "Low divergence: cohorts roughly aligned"
The interpretation thresholds here are illustrative starting points. Your actual calibration depends on the assets you watch and how frequently divergence tends to resolve. Log the values for a few days before trusting any fixed threshold as a trigger.
Layering Bias with Position Metrics for Confirmation
Bias alone tells you direction. Position metrics tell you magnitude. The combination is where conviction analysis lives.
Imagine the Money Printer cohort shows a bias of +0.35 on BTC. That's a clear long lean. But how much capital is behind it? The position-metrics endpoint answers that question with actual notional values, so you can see whether the lean represents millions in exposure or a handful of small positions that happen to point the same direction.
def full_cohort_picture(coin, segment_id):
    # Current bias direction
    bias = fetch_bias_history(segment_id)
    latest_bias = bias[0]["bias"] if bias else None

    # Current notional exposure
    summary = fetch_segment_summary(segment_id)
    long_val = summary.get("longNotional", 0)
    short_val = summary.get("shortNotional", 0)

    # Historical trend (2 weeks)
    metrics = fetch_cohort_position_metrics(coin, segment_id, days_back=14)
    trend = []
    for m in metrics[-5:]:
        total = m["longValue"] + m["shortValue"]
        trend.append(m["longValue"] / total if total > 0 else 0.5)

    avg_trend = sum(trend) / len(trend) if trend else 0.5

    return {
        "segment_id": segment_id,
        "coin": coin,
        "current_bias": latest_bias,
        "long_notional": long_val,
        "short_notional": short_val,
        "trend_avg_long_pct": round(avg_trend, 3),
        # Example thresholds for illustration
        "conviction": "HIGH" if abs(latest_bias or 0) > 0.25
                      and abs(avg_trend - 0.5) > 0.1 else "MODERATE"
    }

# Compare two cohorts on BTC
mp_picture = full_cohort_picture("BTC", 8)   # Money Printer
gr_picture = full_cohort_picture("BTC", 15)  # Giga-Rekt
print(f"Money Printer: bias={mp_picture['current_bias']}, "
      f"${mp_picture['long_notional']:,.0f} long")
print(f"Giga-Rekt: bias={gr_picture['current_bias']}, "
      f"${gr_picture['short_notional']:,.0f} short")
This combined view tells you three things at once: the direction (bias), the capital behind it (summary), and whether the current positioning is consistent with the recent trend (position-metrics). All three agreeing is a higher-confidence signal than any one alone.
Rate Limits and Polling Strategy
Each bias-history call is one API request per segment. With 16 cohorts, a full sweep costs 16 requests. Add segment summaries (16 more) and position-metrics for your top 3 coins across 4 key cohorts (12 more), and a complete dashboard refresh runs about 44 requests.
On the free tier, 100 daily requests let you run a full 44-request refresh twice a day, with room for ad hoc queries. That's enough for a daily morning-and-evening bias check. For continuous monitoring at 5-minute intervals, the Pulse tier at $179/mo gives you 50,000 monthly requests. At 44 requests per cycle and 288 cycles per day, that's 12,672 requests per day, well within the monthly budget of roughly 1,600 per day. Narrow your sweep to the 4 most important cohorts and 2 coins to bring the per-cycle cost down to around 12 requests, and you're running 24/7 comfortably.
Polling tip: Our data refreshes approximately every 5 minutes for most endpoints, with aggregate analytics updating every 12 to 15 minutes. Polling faster than every 5 minutes returns the same snapshot and wastes your request budget.
What Bias Cannot Tell You
Cohort bias is a powerful lens, but it has edges. A few important ones to keep in mind:
- No single-wallet attribution. Bias is aggregate. If you need to know what a specific whale is doing, use the
/positionsendpoint with an address filter. - 12-hour rolling window for bias-history. You can't backtest a bias-based strategy with this endpoint alone. Use
/position-metrics/coin/{coin}/segment/{segmentId}for multi-day lookback (approximately 4 weeks), or/positionsfor deeper historical analysis (approximately 10 months). - Bias doesn't predict direction. It shows you where positioned capital sits. Whether the positioned capital is right or wrong is a separate question. Historical analysis of cohort accuracy is possible with the position-metrics endpoint, but the bias value itself is descriptive, not predictive.
- Hedging and basis trades muddy the signal. A wallet that's long spot and short perps shows up as short in the bias calculation, even though their actual directional exposure is neutral. Cohort aggregation smooths this noise, but it doesn't eliminate it.
Start Querying Cohort Bias Today
The free tier gives you 100 API calls per day. Enough to pull bias snapshots for every cohort, twice daily, and start building your divergence dashboard.
Cohort bias is the shortest path from raw positioning data to a market structure opinion. Three endpoints, a few lines of Python, and you can see whether the wallets that historically win are leaning the same direction as the wallets that historically lose. When they agree, the market has consensus. When they disagree, something is about to resolve. Your job is to be watching when it does.