Your Risk Engine Is Blind Without Liquidation Scores
By CMM Team - 13-Jul-2026
Your Risk Engine Is Blind Without Liquidation Scores
On July 4, gold perpetual futures on Hyperliquid dropped approximately $100 in under a minute before arbitrage bots snapped the price back. Traders holding leveraged longs during that 60-second window got liquidated before they could blink. The contract eventually self-corrected, but the damage was done.
Flash crashes like this don't announce themselves. They happen during holiday weekends, thin-liquidity windows, and oracle mismatches. If your risk engine only watches price and margin, it's flying blind to the pressure building beneath the surface. Liquidation risk scoring fills that gap: it tells you how much open interest in a given asset sits close to forced closure, broken down by the behavioral cohort holding it.
This article shows you how to wire HyperTracker's liquidation risk endpoint into a working risk engine. By the end, you'll have Python code that polls risk scores, filters by cohort, and fires alerts before cascades start.
What Liquidation Risk Scoring Actually Measures
Most risk dashboards track margin ratios. That's useful for your own positions, but it tells you nothing about the broader market. Liquidation risk scoring inverts the question: instead of "am I about to get liquidated," it asks "how much of the market is about to get liquidated?"
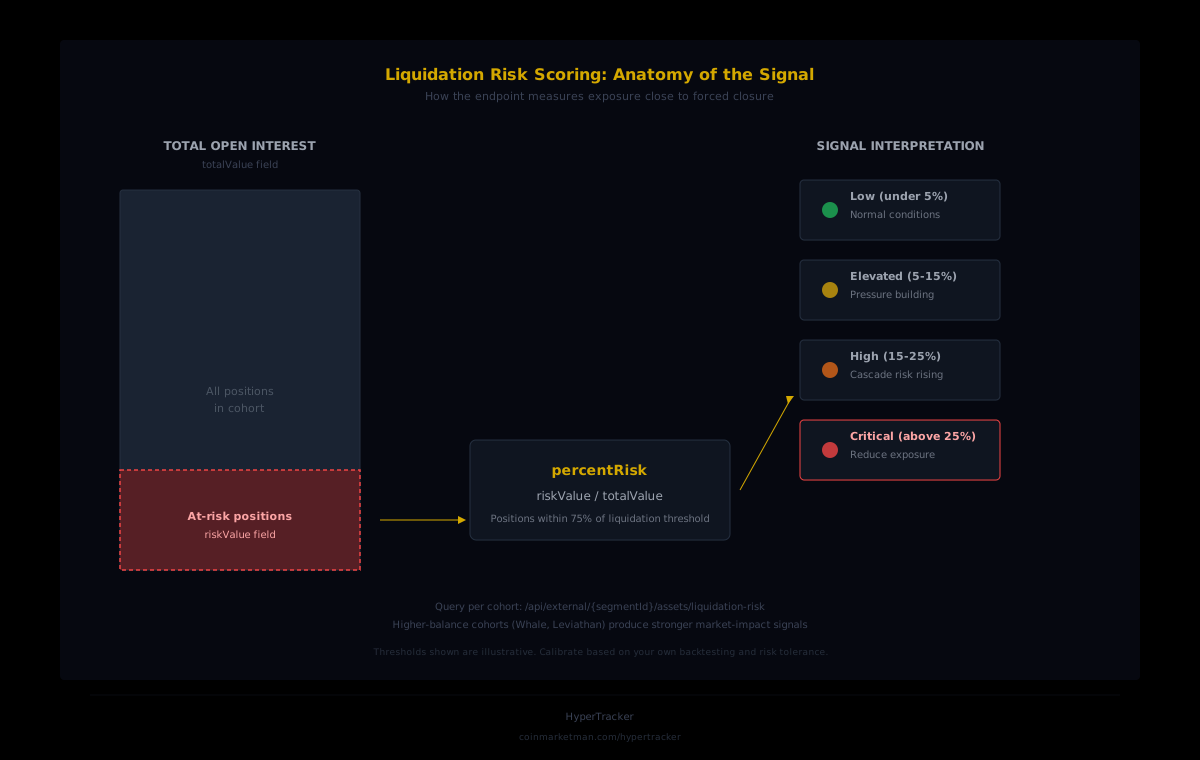
Our liquidation risk endpoint returns three fields for each asset within a given cohort:
totalValue: total open interest for that asset in the cohortriskValue: the dollar amount of positions sitting within 75% of their liquidation thresholdpercentRisk: the ratio of at-risk value to total exposure
A percentRisk of 18% on ETH in the Whale cohort means nearly a fifth of all Whale-held ETH positions are close to forced closure. That's a leading indicator. When leveraged large positions cluster near liquidation, a relatively small price move can trigger a cascade: forced sells push price down, which triggers more liquidations, which pushes price further.
The Endpoint: One Call, Every Asset
The liquidation risk endpoint lives at:
GET /api/external/{segmentId}/assets/liquidation-risk
Pass a cohort's segment ID as a path parameter, and you get back a ranked list of assets by risk exposure. The response includes totalCount (how many assets have positions in this cohort) and an items array with each asset's risk breakdown.
Here's the full list of cohort IDs you can query:
| Cohort | Type | ID | |---|---|---| | Shrimp ($0-$250) | Size | 16 | | Fish ($250-$10K) | Size | 1 | | Dolphin ($10K-$50K) | Size | 2 | | Apex Predator ($50K-$100K) | Size | 3 | | Small Whale ($100K-$500K) | Size | 4 | | Whale ($500K-$1M) | Size | 5 | | Tidal Whale ($1M-$5M) | Size | 6 | | Leviathan ($5M+) | Size | 7 | | Money Printer (+$1M+) | PnL | 8 | | Smart Money (+$100K-$1M) | PnL | 9 | | Consistent Grinder (+$10K-$100K) | PnL | 10 | | Humble Earner ($0-$10K) | PnL | 11 | | Exit Liquidity (-$10K-$0) | PnL | 12 | | Semi-Rekt (-$100K to -$10K) | PnL | 13 | | Full Rekt (-$1M to -$100K) | PnL | 14 | | Giga-Rekt (below -$1M) | PnL | 15 |
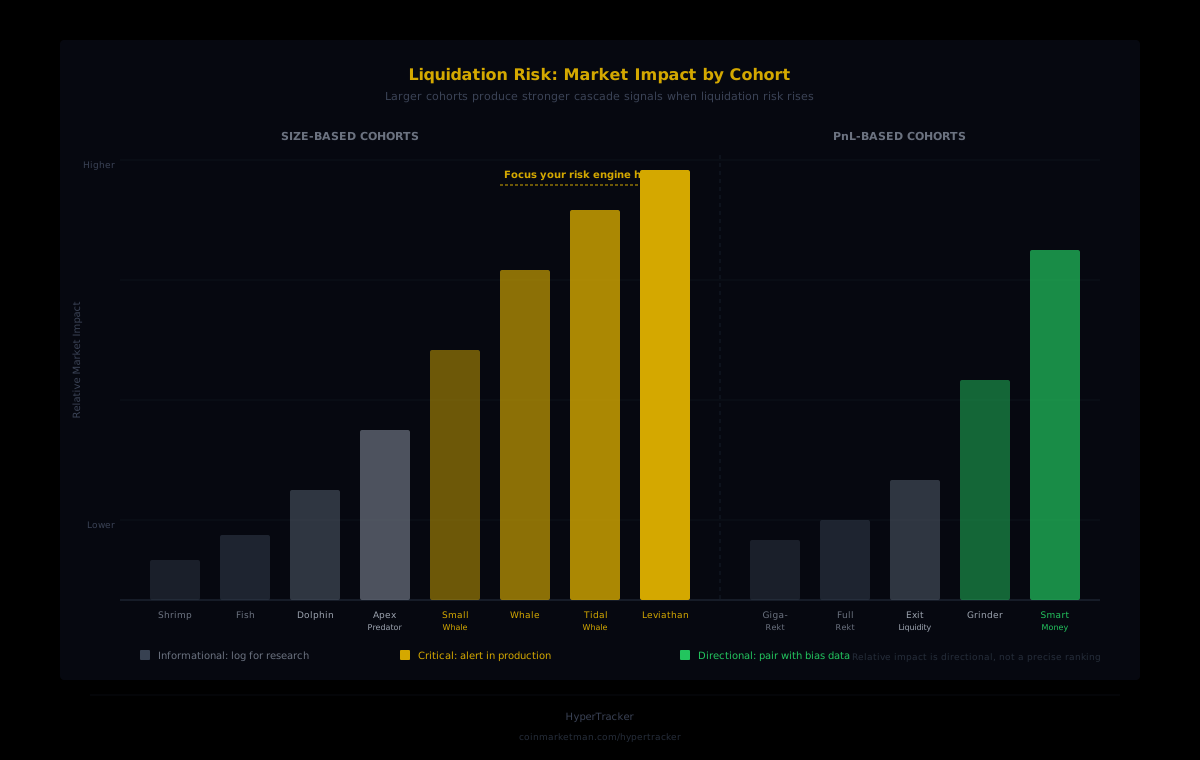
The signal quality depends on which cohort you query. Whale and Leviathan liquidations move markets because the forced closure volume is large enough to impact price. Shrimp liquidations are noise. So your risk engine should weight the scores accordingly.
Wiring It Up: A Minimal Python Risk Monitor
Here's a working risk monitor in under 50 lines. It polls the liquidation risk endpoint for the cohorts that matter most (Whale, Tidal Whale, Leviathan, Smart Money, Money Printer), computes a weighted score, and fires an alert when the aggregate crosses a threshold you define.
import requests, time, json

API_BASE = "https://ht-api.coinmarketman.com/api/external"
TOKEN = "YOUR_JWT_TOKEN"
HEADERS = {"Authorization": f"Bearer {TOKEN}"}

# Cohorts that move markets, with relative weights
WATCHED_COHORTS = {
    5: {"name": "Whale", "weight": 1.0},
    6: {"name": "Tidal Whale", "weight": 1.5},
    7: {"name": "Leviathan", "weight": 2.0},
    9: {"name": "Smart Money", "weight": 1.2},
    8: {"name": "Money Printer", "weight": 1.3},
}

ALERT_THRESHOLD = 15.0  # weighted percentRisk to trigger alert
POLL_INTERVAL = 300     # 5 minutes, matches API refresh

def get_risk(segment_id):
    url = f"{API_BASE}/{segment_id}/assets/liquidation-risk"
    resp = requests.get(url, headers=HEADERS)
    resp.raise_for_status()
    return resp.json()["items"]

def compute_weighted_risk(coin):
    """Compute weighted risk score for a single asset across cohorts."""
    total_weight = 0
    weighted_sum = 0
    for seg_id, meta in WATCHED_COHORTS.items():
        assets = get_risk(seg_id)
        match = next((a for a in assets if a["coin"] == coin), None)
        if match:
            weighted_sum += match["percentRisk"] * meta["weight"]
            total_weight += meta["weight"]
    return weighted_sum / total_weight if total_weight else 0

def scan_and_alert():
    # Pull one cohort to get the asset list
    all_assets = get_risk(5)
    for asset in all_assets:
        score = compute_weighted_risk(asset["coin"])
        if score >= ALERT_THRESHOLD:
            print(f"ALERT: {asset['coin']} weighted risk = {score:.1f}%")
            # Replace with your webhook, Telegram bot, or Slack call
            fire_alert(asset["coin"], score)

while True:
    scan_and_alert()
    time.sleep(POLL_INTERVAL)
Note on the threshold and weights above. The ALERT_THRESHOLD of 15.0 and the cohort weights are illustrative starting points. You should calibrate both based on your own backtesting and risk tolerance. HyperTracker classifies wallets into cohorts. It does not prescribe specific risk thresholds or position sizing rules.
Filtering by Cohort: Why It Matters
A naive approach would query all 16 cohorts and average their risk scores. That's worse than useless, because it dilutes the signal. When Shrimp positions pile up near liquidation, the market barely notices. When Leviathans are at risk, the forced selling volume can create the cascading liquidations that produce flash crashes.
The code above handles this by assigning higher weights to large-balance cohorts. But you can also build separate alert tiers:
- Tier 1 (critical): Leviathan, Tidal Whale, Money Printer. Positions here represent the largest notional exposure. Fire immediately on elevated risk.
- Tier 2 (warning): Whale, Small Whale, Smart Money. Meaningful volume, but less market-moving.
- Tier 3 (informational): Everything else. Log for research and backtesting, don't alert in production.
This tiered structure keeps your alert channel clean. A risk engine that alerts on everything alerts on nothing, because the operator stops paying attention.
From Scores to Decisions: What Your Bot Should Do
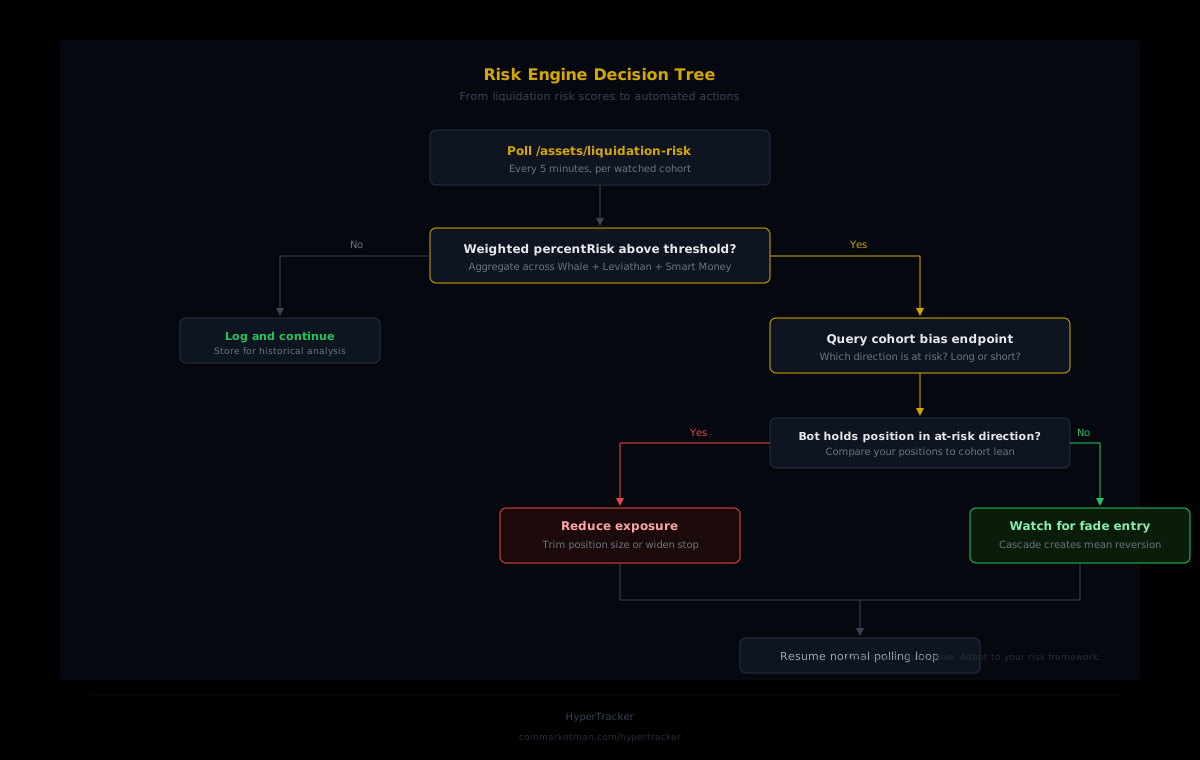
Raw risk scores are observation. Decisions are what separate a monitoring dashboard from a risk engine. Here's how to translate elevated liquidation risk into automated actions:
Reduce exposure before the cascade
If your bot is long ETH and the weighted liquidation risk score for ETH spikes above your threshold, that's a signal to reduce position size or widen your stop. The logic is simple: elevated risk means a pool of leveraged positions is close to forced closure, and forced closure of large positions can drive price against you. You don't need to predict the direction. You just need to get smaller.
Spot the fade opportunity after the flush
Cascading liquidations tend to overshoot. After a flush, liquidation risk scores drop sharply because the at-risk positions have already been closed. That's often when mean reversion kicks in. If your bot tracks risk scores over time, a sudden drop from high to low can be a signal that the forced selling is done and the snapback is coming.
Cross-reference with cohort bias
Liquidation risk tells you pressure is building. Cohort bias tells you which direction. If Leviathans are overwhelmingly long and their liquidation risk is climbing, that's a directional signal: the forced selling, if it happens, will be on the long side. Pair the /assets/liquidation-risk endpoint with the /bias endpoint for a richer picture.
Real-World Context: Why This Matters Now
Hyperliquid's total open interest reached $11.07 billion on July 13, the highest level of 2026. More open interest means more positions, more leverage, and more potential liquidation volume. As the platform grows, the gap between "monitoring your own margin" and "monitoring the market's margin" widens.
The July 4 gold flash crash is a textbook example. Gold perpetuals dropped approximately $100 in under a minute, driven by thin holiday liquidity and oracle price deviation. The contract recovered quickly, but anyone holding a leveraged long during that 60-second window got liquidated before they could react. A risk engine that tracked liquidation risk scores on gold would have flagged the elevated cluster of at-risk positions before the crash happened.
This pattern repeats. In late May 2026, Hyperliquid's SpaceX pre-IPO perpetual fell about 45% in roughly 30 minutes after an oracle data issue, liquidating $1.51 million across 1,393 positions. Different asset, same mechanism: concentrated leverage near liquidation thresholds, a trigger event, and a cascade. The only variable is whether your risk engine saw it coming.
Putting It Into Production
The minimal monitor above works for prototyping. For production, you'll want a few additions:
- Persistent state: Store historical risk scores in a time-series database (InfluxDB, TimescaleDB, or even a flat CSV). This lets you backtest your threshold calibration and spot trends.
- Webhook delivery: If you're on the Flow ($799/mo) or Stream ($1,999/mo) tier, you can receive push updates via webhooks instead of polling. That eliminates the 5-minute polling gap and gives you risk data as soon as it refreshes.
- Multi-asset correlation: When liquidation risk spikes simultaneously across several assets in the same cohort, that's a broader deleveraging event. Your risk engine should detect correlated spikes and respond to the aggregate signal, because a correlated spike is more dangerous than an isolated one.
- Dashboard layer: Pipe our liquidation risk data into Grafana, Retool, or a custom frontend. Visualizing risk scores over time, overlaid with price, makes pattern recognition much faster than reading log output.
Build vs. buy math: Building equivalent liquidation risk scoring from raw Hyperliquid data means ingesting every position, computing proximity to liquidation thresholds, classifying wallets into behavioral segments, and aggregating by cohort. That's a data pipeline that takes months to build and costs $10,000+/month to run. The HyperTracker API gives you the same intelligence starting at $179/mo with a single REST call.
Add liquidation risk scoring to your risk engine
16 behavioral cohorts. Asset-level risk exposure. One API call. Start building on the free tier.
Your risk engine already tracks margin and PnL. Liquidation risk scoring adds the layer it's been missing: what the rest of the market is about to be forced to do. In a market where flash crashes play out in 60 seconds, that foresight is the difference between reducing exposure and becoming the exit liquidity.