
Bitcoin Capitulation Signals That UTXOs Can't See
By CMM Team - 28-Jun-2026
Bitcoin Capitulation Signals That UTXOs Can't See
The UTXO profit/loss ratio just hit its lowest level of this bear cycle. Analyst Darkfost flagged it as the first bottom signal of the current correction, and on-chain Twitter lit up within hours. The last time this metric dropped to a similar level was mid-2023, when BTC sat around $26,000.
That signal is real. But it is also incomplete. UTXO-based metrics measure Layer 1 activity: coins moving between wallets, holders selling at a loss, spent outputs revealing capitulation among on-chain participants. What they cannot measure is the perpetual futures market, where the majority of leveraged speculation and forced liquidation happens. Funding rates, open interest deleveraging, and cohort-level positioning shifts all carry capitulation signals that never touch a UTXO.
This article breaks down the on-chain capitulation signals getting attention right now, explains what they structurally miss, and shows where perps data fills the gap.
The on-chain capitulation case
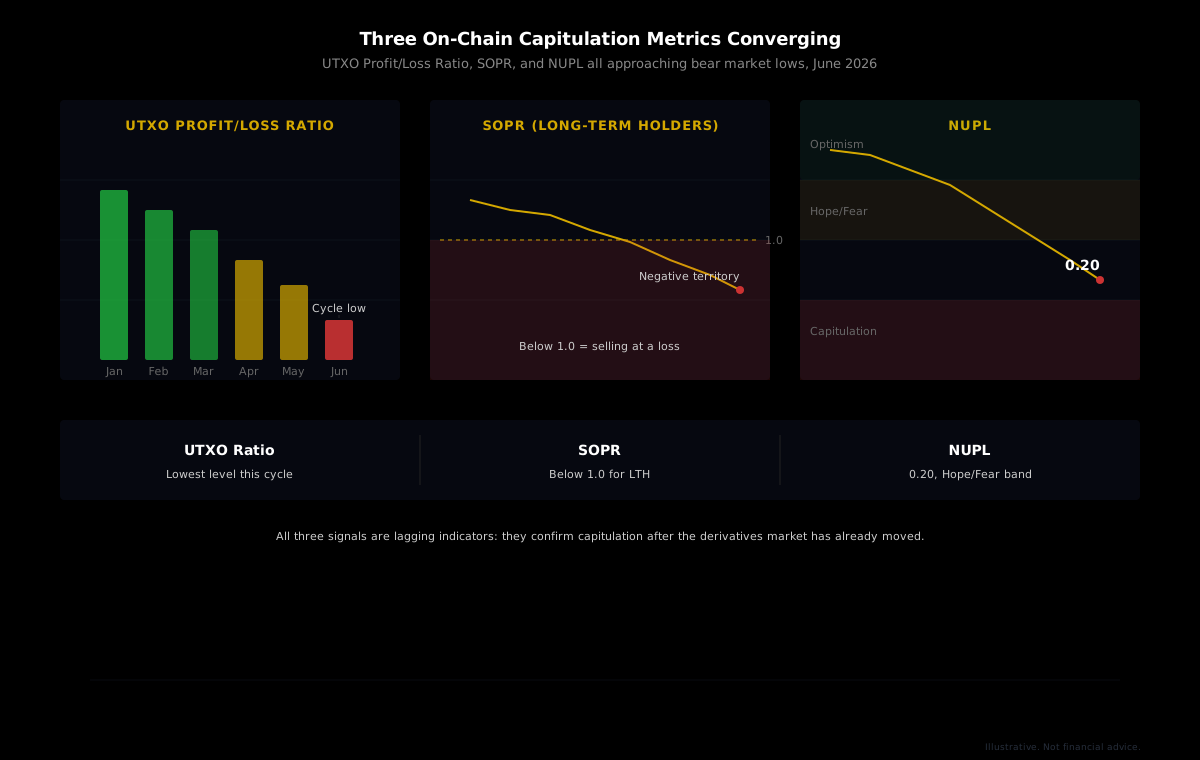
Three metrics are converging. First, the UTXO spent-profit ratio. When the number of outputs spent at a loss overwhelms those spent in profit, it signals that holders are capitulating rather than taking gains. Darkfost's analysis shows this ratio at its lowest point since the correction began, "reflecting the start of a broader capitulation."
Second, SOPR. The Spent Output Profit Ratio tracks whether coins are being moved at a gain or a loss. Long-term holder SOPR is "gradually moving into negative territory, suggesting those investors are entering a capitulation phase." When long-term holders start selling at a loss, the market has moved past the "maybe it bounces" phase into genuine pain.
Third, NUPL. VanEck's mid-June Bitcoin ChainCheck reported NUPL at 0.20, with the 30-day average at 0.25 versus 0.33 the prior month. The share of supply in profit slid from 64% to 54%. Those numbers put BTC squarely in the "Hope/Fear" band, which historically marks the transition zone between correction and capitulation.
The blind spot: everything off-chain
UTXO analysis is structurally conservative. It only captures Layer 1 activity: coins moving between addresses on the Bitcoin base layer. Activity on exchanges, Layer 2 networks, or wrapped assets does not appear in the UTXO set.
That matters enormously in 2026 because the derivatives market is where capitulation plays out fastest. When a leveraged long gets liquidated on a perpetual futures exchange, no UTXO moves. The position closes, the margin is absorbed, the price impact ripples through spot markets, but the on-chain data registers nothing. A cascade that wipes billions in open interest looks, from the UTXO lens, like a quiet day.
This is the core limitation. The Amberdata derivatives report from a recent capitulation episode showed $2.56 billion in positions wiped in a single weekend session, with total open interest collapsing 14.9% to $63.38 billion. That is the largest liquidation cascade since October's $19 billion event. None of that showed up in UTXO data.
On-chain analysts watching SOPR and NUPL saw the aftermath: coins moving to exchanges, holders capitulating at a loss. But the cause, the forced selling from leveraged derivatives, happened entirely off their radar. The derivatives flush created the conditions for on-chain capitulation, which means the perps data led and the UTXO data lagged.
Funding rates as a capitulation signal
Perpetual futures use a funding rate mechanism to tether the contract price to spot. When longs dominate, they pay shorts. When shorts dominate, shorts pay longs. The direction and magnitude of funding rates reflect real-time sentiment more precisely than any on-chain metric, because funding settles on Hyperliquid every hour (compared to 8 hours on centralized exchanges).
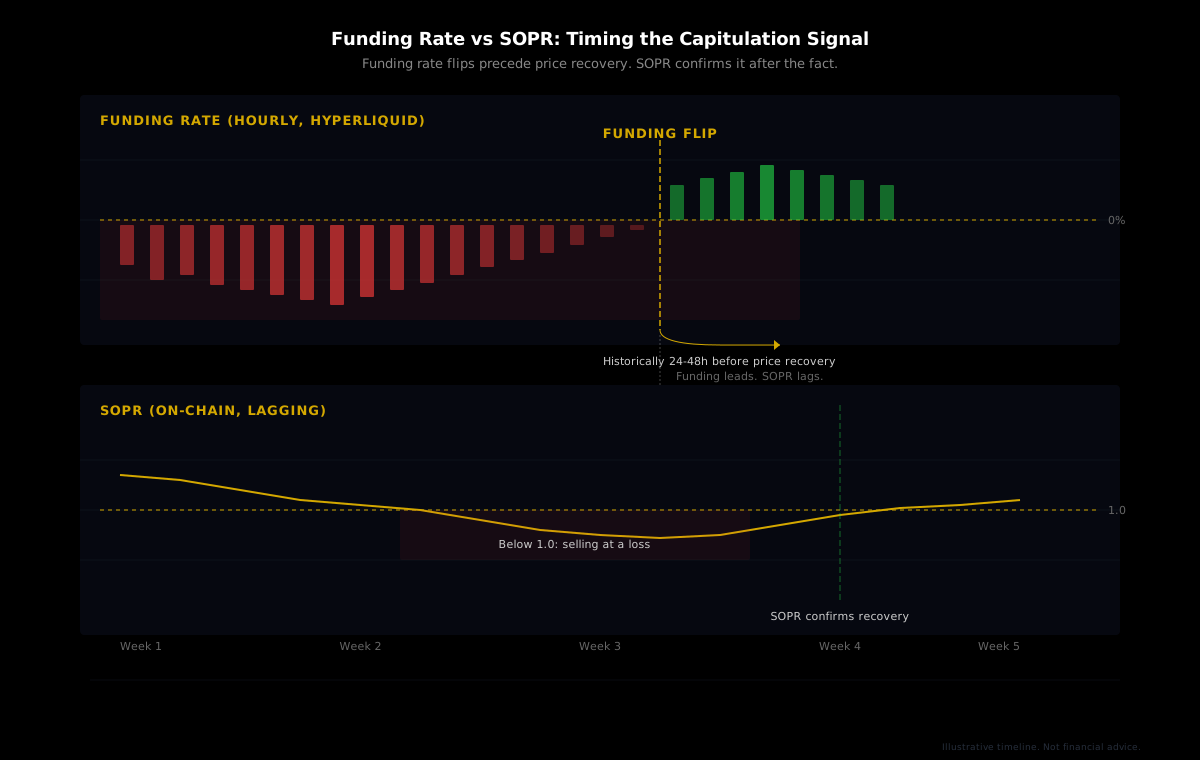
In a capitulation scenario, funding flipping deeply negative is the signal. It means shorts are overcrowded, long holders have been flushed, and the remaining market participants are actively betting on further downside. This is the derivatives equivalent of what SOPR measures on-chain: the market is selling at a loss, expecting worse.
But funding carries an edge over SOPR in one critical dimension: timing. When funding turns positive after a sustained negative streak, it historically signals that the short side has capitulated. That flip typically precedes the most explosive portion of a recovery by 24 to 48 hours, because it means bears are closing their positions and the balance of leveraged money is shifting.
SOPR, by contrast, shows you what happened when coins were moved. Funding shows you what is happening right now.
Open interest: the deleveraging that UTXOs miss
Open interest measures the total outstanding positions in a market. When OI drops sharply alongside price, it signals forced liquidations: positions are closing because margin was exhausted, not because traders chose to exit. That cascade mechanism is the single most violent price action driver in crypto, and it is completely invisible to UTXO analysis.
The recent market structure tells the story. The Amberdata report showed BTC open interest falling 14.1% to $27.61 billion in a single week. Bitcoin ETFs simultaneously saw over $1.29 billion in weekly outflows, with BlackRock's IBIT alone shedding over $942 million. The Fear and Greed Index hit Extreme Fear at 14.
That constellation, OI collapsing alongside ETF outflows and extreme fear, is the derivatives version of capitulation. It represents leveraged participants being forced out. And importantly, once the most vulnerable positions are liquidated, the cascade pressure stops. An OI floor often coincides with a price floor because the forced sellers are gone.
On-chain UTXO data eventually catches the downstream effects: coins moving to exchanges, realized losses climbing. VanEck's data showed realized losses jumping 78% month-over-month while realized profit collapsed 57%. But the OI collapse preceded it. The derivatives market capitulated first, then on-chain holders followed.
Who is capitulating: the cohort layer
UTXO metrics tell you that coins are being spent at a loss. They do not tell you whose coins they are, in any behaviorally useful way. You can distinguish short-term holders from long-term holders by coin age, and that distinction matters. But you cannot distinguish profitable traders from losing traders, large accounts from small ones, or sophisticated participants from retail.
On Hyperliquid, every position is onchain and transparent. That transparency enables cohort-level analysis: breaking down positioning by wallet size and by all-time profitability. Our data classifies wallets into 16 behavioral cohorts, eight by size (from Shrimp up to Leviathan) and eight by lifetime PnL (from Giga-Rekt up to Money Printer).
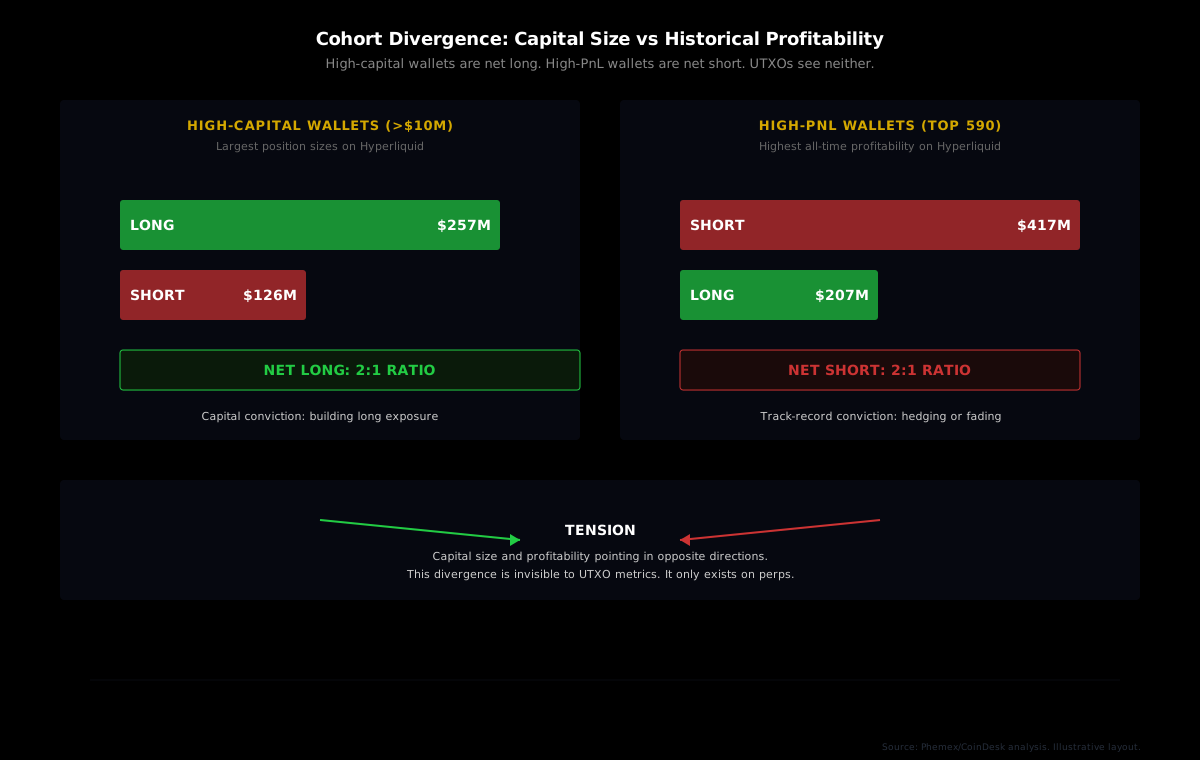
During capitulation events, the cohort divergence is where the real intelligence sits. A Phemex/CoinDesk analysis showed that wallets running positions above $10 million on Hyperliquid held roughly $257 million in BTC longs against $126 million in shorts, a 2-to-1 long imbalance. But the 590 highest-profit wallets were net short, holding $417 million in BTC shorts against $207 million in longs.
That split, largest capital bullish while highest-PnL traders bearish, is a signal UTXOs will never surface. It reveals a structural tension: capital size and historical profitability are pointing in opposite directions. When that tension resolves, historically capital size has won. But both sides carry information, and tracking the shift in real time beats waiting for UTXO data to show up days later.
Building a composite capitulation read
The strongest capitulation reads combine both layers. On-chain UTXO metrics tell you that holders are selling at a loss and the market is in pain. Perps data tells you how leveraged the pain is, who is being forced out, and when the forced selling is exhausting itself.
A practical composite framework would layer these signals:
| Signal Layer | Data Source | What It Captures | Timing | | --- | --- | --- | --- | | UTXO profit/loss ratio | On-chain (Glassnode, CryptoQuant) | Holder capitulation, coins moving at a loss | Lagging (hours to days) | | SOPR | On-chain | Whether moved coins were profitable at time of spend | Lagging (hours) | | NUPL | On-chain | Aggregate unrealized profit/loss of all holders | Lagging (daily) | | Funding rate | Perps (Hyperliquid: hourly) | Leveraged sentiment, short/long imbalance | Real-time (hourly settle) | | Open interest change | Perps (all exchanges) | Forced liquidations, deleveraging, position closure | Real-time | | Cohort positioning | Perps (Hyperliquid via HyperTracker) | Who is building, who is exiting, smart money vs retail | Near real-time (5-min refresh) |
The sequencing matters. In the recent selloff, derivatives data signaled capitulation first: OI collapsed, funding went negative, liquidations cascaded. Hours to days later, on-chain metrics confirmed it: SOPR turned negative, UTXO profit/loss ratio dropped to cycle lows, NUPL fell into the Hope/Fear band. A trader watching only on-chain data saw the confirmation after the worst of the flush was already over.
A composite read catches both the leading and lagging signals. And critically, the cohort layer from Hyperliquid adds a dimension that neither traditional on-chain analytics nor aggregate perps data can provide: the behavioral identity of who is driving the capitulation.
See who is capitulating, by cohort
HyperTracker's API breaks down Hyperliquid positioning across 16 behavioral cohorts, from Shrimp to Leviathan, from Giga-Rekt to Money Printer. Track which segments are building, which are exiting, and where the smart money divergence sits. One API call, pre-computed intelligence.
What this means for the current cycle
The convergence of on-chain and derivatives capitulation signals in June 2026 is significant because both layers are now flashing simultaneously. UTXO data says holders are selling at a loss at rates consistent with prior bear market bottoms. Derivatives data says leveraged longs have been flushed, OI has contracted sharply, and funding has turned negative.
The divergence worth watching is the cohort tension on Hyperliquid: high-capital wallets leaning long while high-PnL wallets lean short. That tension usually resolves with one side capitulating, and our data makes it visible in near real-time rather than days after the fact.
On-chain analysis built the framework for understanding capitulation. The UTXO spent-profit ratio, SOPR, and NUPL are proven signals with decade-long track records. But the market has structurally evolved. Perpetual futures now drive the fastest and most violent phases of capitulation, and they are invisible to UTXO-based metrics. A complete capitulation read in 2026 requires both layers.
The on-chain analysts are right that capitulation signals are flashing. They are just looking at half the picture.