
Strategy Crossed 850K BTC. Hyperliquid Whales Went Short.
By CMM Team - 09-Nov-2026
Strategy Crossed 850K BTC. Hyperliquid Whales Went Short.
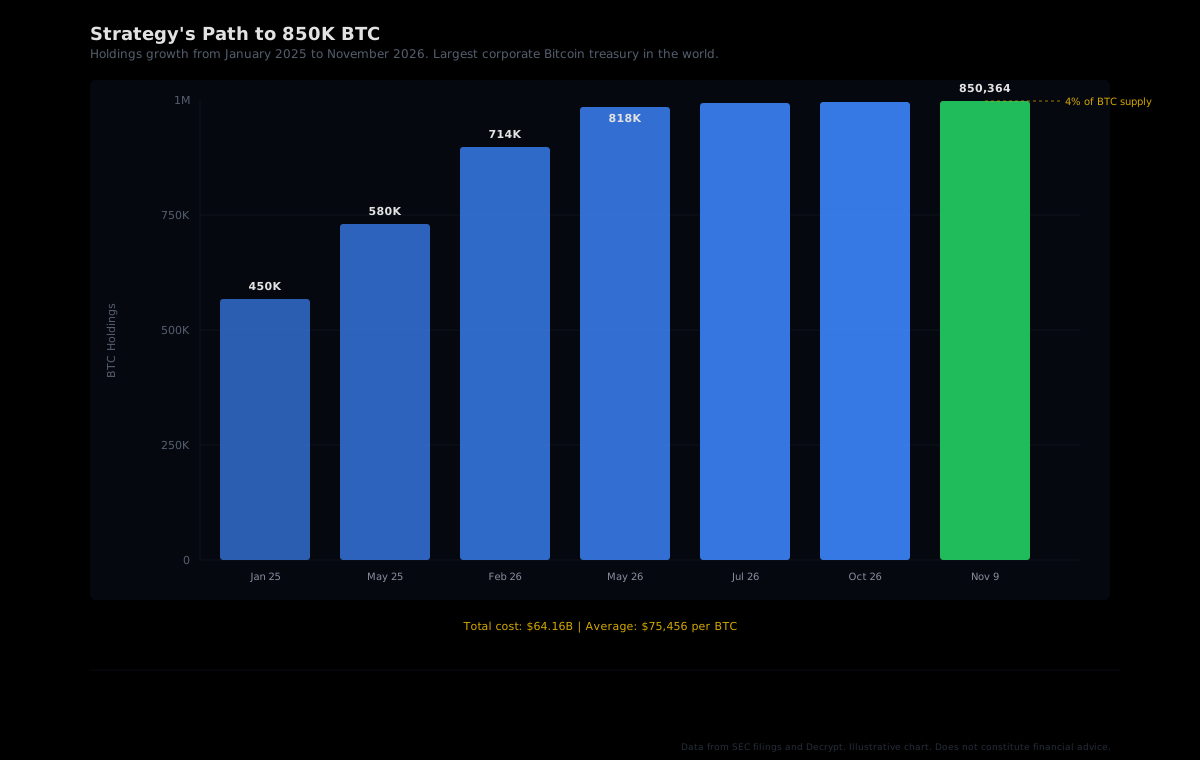
Strategy just crossed 850,000 Bitcoin. On November 9, the company reported holding 850,364 BTC after buying 1,036 coins for $81.9 million during the week of November 2-8. That is over 4% of Bitcoin's total supply in the hands of a single company. Michael Saylor keeps buying.
At the same time, the largest traders on Hyperliquid are doing the opposite. According to data tracked by Glassnode and reported by CryptoBriefing, whale accounts on Hyperliquid flipped to a net short Bitcoin position on October 27 for the first time in seven months. By November 7, those whale shorts had grown to between $892 million and $924 million, the highest level since October 2025.
One side is accumulating spot Bitcoin at any price. The other side is building the largest short position in over a year. This article unpacks the divergence and explains how cohort analytics can help you figure out which signal matters more.
Strategy's relentless accumulation
Strategy's path to 850K BTC has been steady and aggressive. The company started 2025 holding roughly 450,000 BTC and crossed 500,000 by March of that year. By February 2026, holdings had reached approximately 713,500, and from there the pace barely slowed. In May 2026, Strategy held 818,334 BTC. The Q2 earnings report in July showed 843,775.
The latest week tells the story. Strategy sold 2,051,348 shares of MSTR stock for $283.8 million in net proceeds. Of that, $81.9 million went to buying Bitcoin at an average of $79,012 per coin, while $188.3 million went toward repurchasing STRC preferred stock. The aggregate cost basis now sits at $64.16 billion across all 850,364 coins, at an average of about $75,456 per BTC.
Here is the uncomfortable detail: Bitcoin was trading around $74,691 when the filing dropped, which puts Strategy's aggregate position slightly underwater. The company paid an average of $75,456 for its entire stack, and the market is currently below that. Saylor has been here before, sitting on unrealized losses during the 2022 bear market before eventually seeing the position recover. Whether that pattern repeats depends on what happens next.
The Hyperliquid short wall
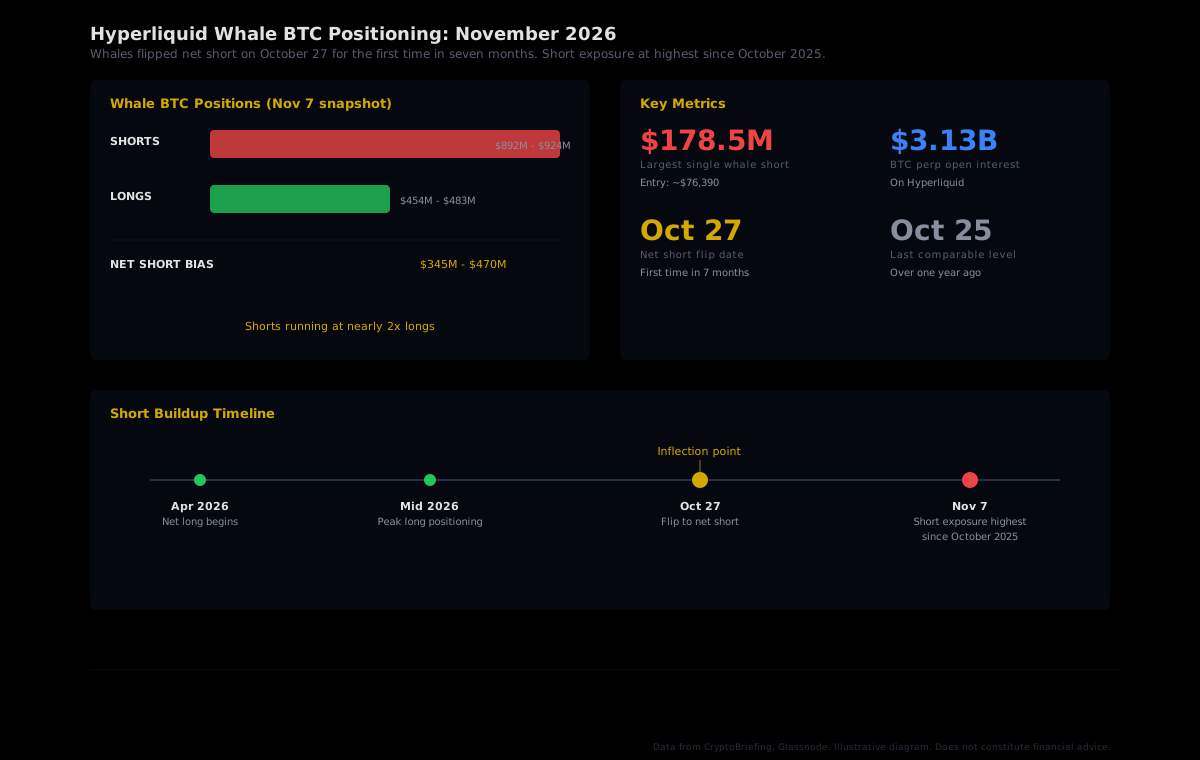
While Strategy keeps buying spot, the whale cohort on Hyperliquid has been building the opposite position. The shift began on October 27, when tracked whale accounts flipped from net long to net short for the first time since roughly March 2026. They have been adding to that stance every day since.
The scale is significant. As of November 7, whale BTC shorts on Hyperliquid ranged from $892 million to $924 million, while longs sat between $454 million and $483 million. That puts the net short bias at roughly $345 million to $470 million, with shorts running at nearly double the size of longs.
The largest single whale short is approximately $178.5 million, opened at an entry price around $76,390. Other notable positions include shorts of $155 million and $101.8 million, plus several more above $60 million each. Total Bitcoin perpetual open interest on Hyperliquid sits at roughly $3.13 billion.
Why the divergence matters
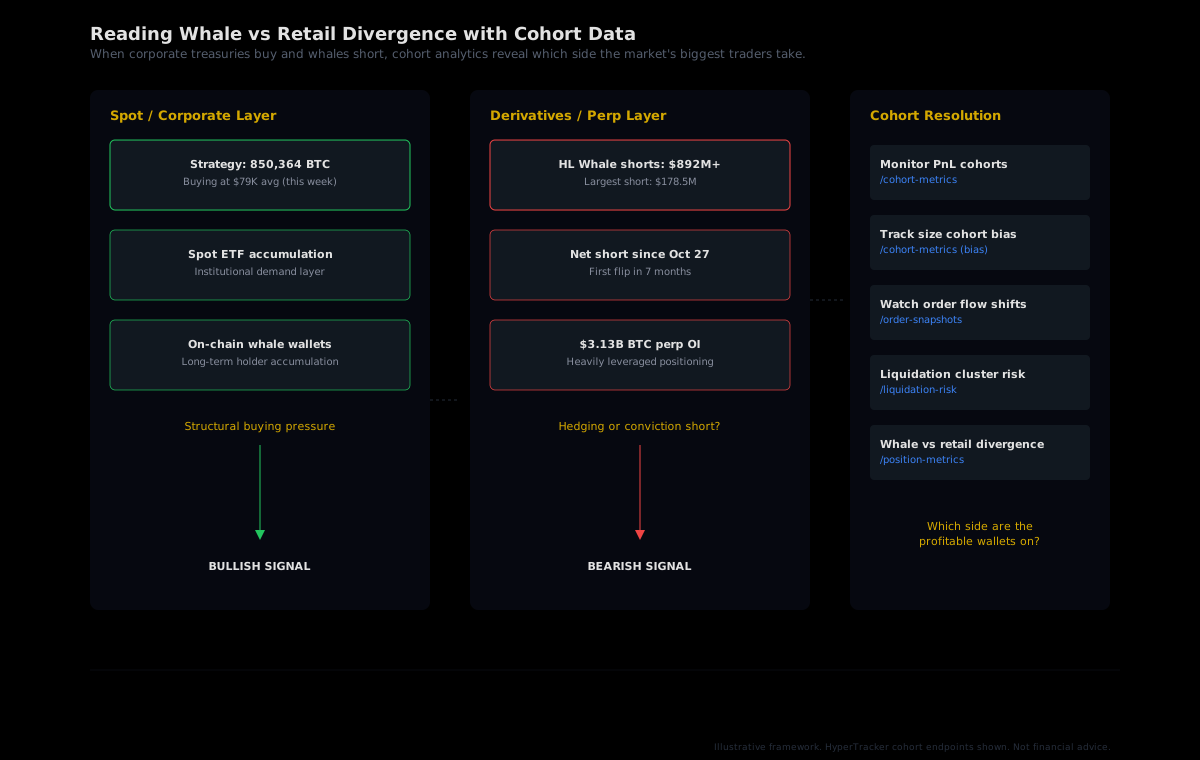
At first glance, these two signals seem contradictory. Strategy is buying as much Bitcoin as it can, suggesting deep conviction in a higher price. Hyperliquid whales are shorting aggressively, suggesting they expect the price to fall further. But both can be rational positions depending on the time horizon and the mechanism behind them.
Strategy is playing a multi-year treasury game. The company has been buying consistently since 2020, through bear markets and bull markets alike. Saylor's stated goal is to accumulate between 5% and 7% of total Bitcoin supply. Whether Bitcoin is at $74,000 or $94,000, the buying continues because the thesis operates on a decade-long timescale.
The Hyperliquid whale shorts operate on a completely different clock. These are leveraged perpetual futures positions, typically held for days to weeks. The largest short entered around $76,390, meaning it is already in profit with BTC trading near $74,700. These positions may reflect genuine directional conviction, macro hedging by funds that hold spot BTC elsewhere, or tactical plays designed to capture a near-term pullback.
The historical precedent adds context. The last time Hyperliquid whale shorts reached comparable levels was October 2025, according to Glassnode. After a similar buildup of short exposure in May 2026, Bitcoin subsequently dropped roughly 28% over the following months. That does not guarantee the same outcome this time, but it establishes that whale short positioning of this magnitude has preceded meaningful downside in the past.
What cohort analytics show that headlines miss
The headline version of this story is simple: "Strategy buys, whales short." But the derivatives market is not monolithic. Different types of traders on Hyperliquid are doing different things, and the aggregate short number obscures those differences.
HyperTracker classifies every wallet on Hyperliquid into 16 behavioral cohorts: eight by account size (from Shrimp at $0-$250 up to Leviathan at $5M+) and eight by all-time PnL (from Money Printer at $1M+ profit down to Giga-Rekt at below -$1M). This dual classification reveals patterns that a single "whale short" number cannot.
Consider a few scenarios this framework illuminates:
- Are Money Printers short? If the wallets with the best all-time track records are building short exposure alongside the size-based whales, that is a stronger bearish signal than if the shorts are concentrated in wallets with mediocre or negative PnL histories.
- Is retail following? If Shrimp and Fish cohorts are also going short, the trade may already be crowded. Crowded shorts create liquidation fuel above current price. If retail is still long while whales are short, the divergence has further room to play out.
- What does order flow show? Net positioning tells you where wallets stand. Order flow tells you what they are doing right now. A whale cohort that is net short but showing buy-side taker flow may be starting to cover.
None of these distinctions are visible in an aggregate "whale short" metric. They require cohort-level data that separates traders by both size and track record, which is exactly what the 16-cohort classification system provides.
The short squeeze scenario
With nearly $900 million in whale shorts concentrated on Hyperliquid, the liquidation risk cuts both ways. If Bitcoin moves higher, those shorts face forced buybacks that could accelerate the move.
The largest single short entered at approximately $76,390. A sustained push above that level would put that $178.5 million position under pressure. Several other large shorts entered at similar levels. The clustering of entry prices creates a liquidation zone where a relatively small move could trigger a cascade of forced covers, which feeds more buying, which triggers more liquidations.
This is the same mechanic that played out in reverse during the May 2026 whale long buildup, when crowded long positioning eventually unwound into a sharp selloff. The direction was different, but the mechanics are identical: crowded leverage in one direction creates vulnerability to a sharp move in the other.
For builders and systematic traders, this creates a monitoring opportunity. Watching the gap between whale and retail positioning, tracking when short exposure starts to decline (potential cover signal), and mapping where the densest liquidation clusters sit are all actionable signals that our data makes accessible through standard API calls.
Tracking the resolution with the HyperTracker API
You do not need to predict whether Strategy or the Hyperliquid whales will be proven right. You need a system that tells you when the positioning starts to shift, so you can react before the crowd. Here is a practical monitoring stack built on the HyperTracker API.
Step 1: Monitor cohort bias by PnL tier
Use the /cohort-metrics endpoint to track whether the highest-PnL cohorts (Money Printer, Smart Money) are leaning long or short on BTC. When these cohorts diverge from the aggregate whale positioning, it often signals an inflection point is approaching.
Step 2: Watch size-cohort positioning shifts
The same endpoint, filtered by size cohorts, reveals whether Leviathan and Tidal Whale accounts are adding to or reducing their directional exposure. A decline in net short positioning from the largest accounts can signal the beginning of a cover cycle before it shows up in aggregate metrics.
Step 3: Track order flow direction
Use /order-snapshots to see whether taker flow is shifting. If whale accounts are net short but buy-side taker flow is increasing, that is an early signal of positioning reversal. Order flow leads positioning because traders adjust their flow before their net exposure catches up.
Step 4: Map liquidation risk
The /liquidation-risk endpoint shows where the densest liquidation clusters sit for each asset. When those clusters align with the entry prices of the largest whale shorts, you have a specific price level to monitor for a potential squeeze trigger.
Track whale positioning shifts before the crowd
HyperTracker classifies every wallet on Hyperliquid into 16 behavioral cohorts by size and PnL. One API call tells you whether the most profitable traders are building or unwinding exposure. Start with the free tier and see what our data shows.
What to watch this week
The next few days will test both sides of this positioning. Strategy keeps buying regardless, so their accumulation pressure is a constant. The variable is the Hyperliquid whale short position and whether it grows, holds, or starts to unwind.
Specific markers worth monitoring:
- Net short bias direction: Is the $345M-$470M net short growing or shrinking? A declining net short suggests early covering.
- BTC price relative to $76,390: The largest whale short entry sits just above where BTC currently trades. A push through that level pressures the biggest position on the platform.
- Retail cohort behavior: If Shrimp and Fish cohorts pile into shorts after the whale move, the trade becomes crowded. Crowded trades resolve violently.
- Strategy's next 8-K: The company reports weekly purchases every Monday. Continued accumulation signals unchanged conviction at the corporate level.
The beauty of on-chain, on-platform data is that you do not have to guess. Both sides of this trade are visible. Strategy's purchases are public filings. Hyperliquid whale positioning is verifiable on-chain. And cohort analytics break down that positioning into the segments that actually matter: who is short, how profitable have they been historically, and are they adding or reducing.
The trade between the world's largest Bitcoin treasury and Hyperliquid's biggest short book resolves in public. The only question is who is watching closely enough to act on the shift when it comes.