
Who Gets Liquidated First on Hyperliquid (and Who Saw It Coming)
By CMM Team - 06-Nov-2026
Who Gets Liquidated First on Hyperliquid (and Who Saw It Coming)
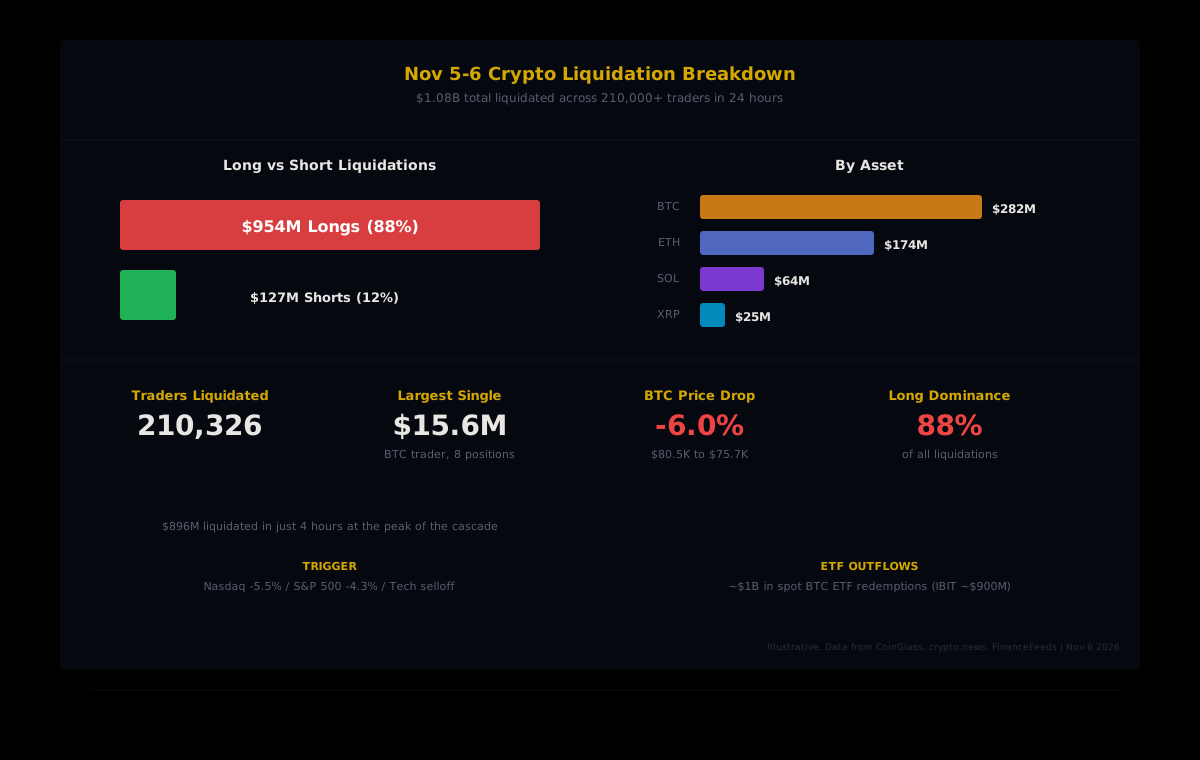
Over $1.08 billion in crypto derivatives positions were liquidated in the 24 hours ending November 6, after a brutal Nasdaq selloff spilled into digital assets. Bitcoin dropped roughly 6% to $75,700, more than 210,000 traders got margin-called, and 88% of the damage fell on longs.
The headline numbers are everywhere by now. What isn't in the headlines is the pattern underneath: which traders absorbed the damage, who got out before the cascade hit, and what the positioning data revealed hours before the flush became front-page news. That's what cohort data is for, and it's what separates traders who read about liquidation events from traders who navigate them.
The Cascade: From Wall Street to Wipeout
The trigger was equities. The S&P 500 fell 4.3% on November 5, the Nasdaq dropped 5.5%, and the Dow lost more than 1,800 points. The tech rout hit crypto bellwethers Strategy and Coinbase, both down roughly 10%, and risk-off sentiment bled into digital assets within hours.
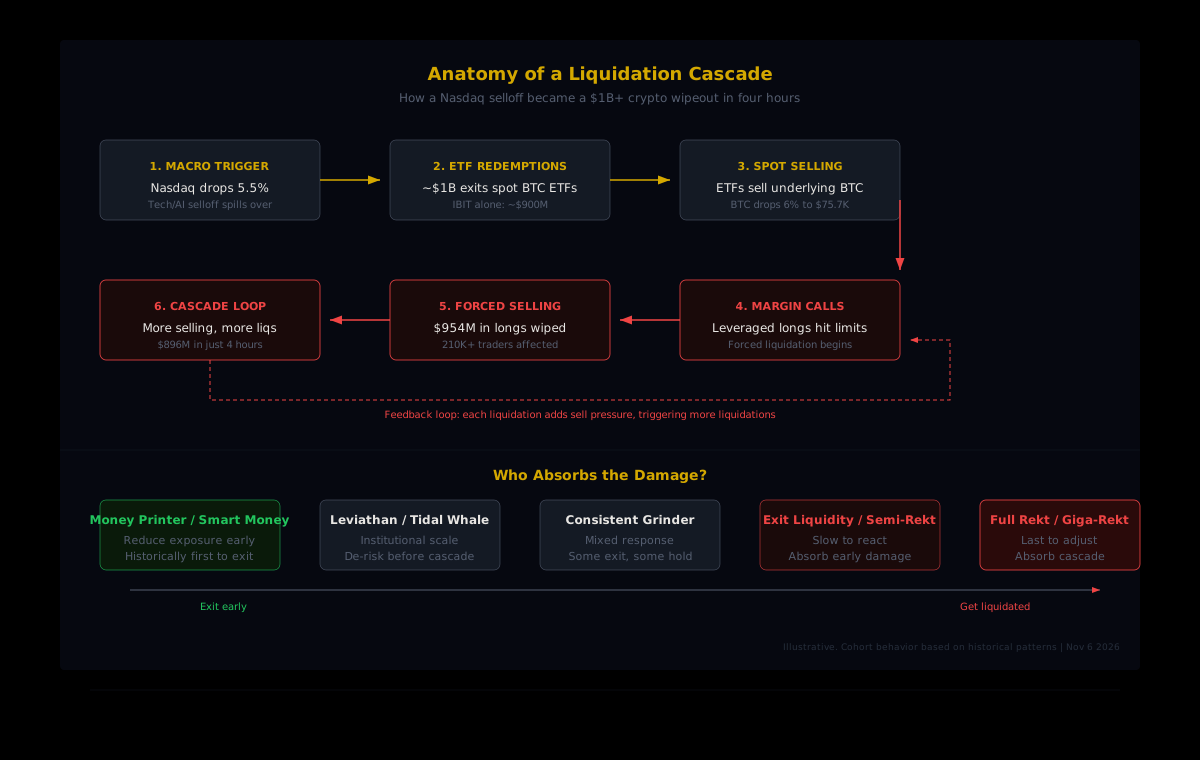
As Bitcoin slid from around $80,500 to a low of $75,700, leveraged long positions started hitting their liquidation thresholds. And once forced selling kicks in, the mechanics are self-reinforcing. Liquidated longs add sell pressure, which pushes price lower, which triggers more margin calls, which forces more selling. The result: $896 million in positions wiped out during a four-hour window at the peak of the cascade.
Ethereum got hit harder in percentage terms, dropping more than 7% to approximately $2,247. ETH accounted for $173.7 million in liquidations, second only to Bitcoin's $282.3 million. The largest single liquidation was a $10.94 million ETH long on Binance, gone in a single execution.
ETF Outflows Poured Gasoline on the Fire
The leverage flush wasn't happening in isolation. US spot Bitcoin ETFs registered approximately $1 billion in total redemptions, with BlackRock's IBIT accounting for roughly $900 million of that figure. When a fund like IBIT processes net outflows, it sells the underlying BTC on spot markets. That spot selling pushes price lower, which accelerates the liquidation cascade on derivatives exchanges.
Think of it as two reinforcing pressure waves hitting simultaneously. Perp liquidations create forced selling on futures venues. ETF redemptions create forced selling on spot venues. Both push price in the same direction, and together they amplify the damage far beyond what either would produce alone. One trader lost $15.6 million across eight positions in a single day. Eight separate margin calls, all triggered by the same cascading pressure.
On Hyperliquid: 11 Accounts, $30.46 Million
Hyperliquid's on-chain transparency gives us a sharper lens into the damage. On November 3, as the broader crypto selloff began, at least 11 accounts on Hyperliquid each recorded more than $1 million in liquidation executions, totaling $30.46 million. Long positions made up $25.82 million of that total (about 85%), while shorts accounted for $4.64 million.
The largest single-account liquidation hit $11.49 million, concentrated in BTC and ETH positions belonging to account 0x4b62. Three HYPE longs were liquidated for $6.12 million combined, two SOL longs for $2.47 million, and even a WTI crude oil long took $1.49 million in partial liquidations across three executions.
The realized losses from these 11 accounts came to roughly $2.14 million. That's the actual capital destroyed after accounting for margin returned. But the positioning damage, the forced closure of $30 million in exposure, ripples through the orderbook and affects every other trader on the platform.
Total Liquidated Tells You Nothing About Who
Here's the problem with every liquidation dashboard and every headline you've read about November 5-6: they tell you the total. $1.08 billion liquidated. 210,000 traders. 88% longs. These are useful numbers for context, but they're useless for positioning.
Knowing that $1 billion got wiped doesn't tell you whether it was a million small retail accounts blowing up their $100 positions or a handful of large accounts with catastrophic leverage. The total is identical in both scenarios. The trading signal is completely different.
If the damage is concentrated in accounts with poor track records and high leverage (the wallets that tend to overextend in every cycle), that's a healthy deleveraging. The market is shaking out weak hands, and a bounce often follows. But if the damage reaches into historically profitable, well-capitalized accounts, that signals something more structural. When the smart money gets margin-called, the recovery is usually slower and the bottom is usually lower.
This is the gap that aggregate liquidation data can't close. You need to know the behavioral profile of who's being liquidated, which requires classifying wallets by their historical performance and their capital base.
How Cohort Analytics Break Down a Liquidation Event
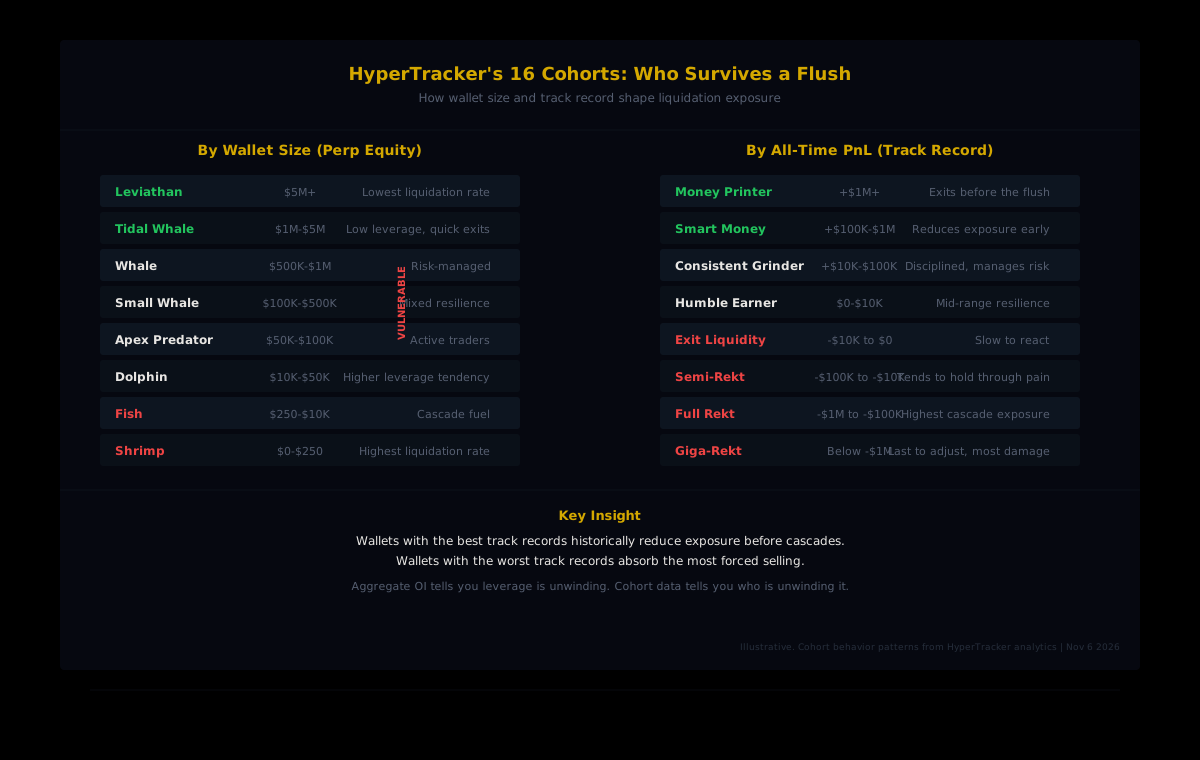
HyperTracker classifies every active wallet on Hyperliquid into one of 16 behavioral cohorts. Eight are based on wallet size (perp equity), ranging from Shrimp ($0-$250) to Leviathan ($5M+). Eight are based on all-time PnL, ranging from Money Printer (+$1M and above) to Giga-Rekt (below -$1M in lifetime losses). One API call gives you the aggregate positioning of each cohort: their net exposure, their leverage distribution, their long/short ratio.
During a liquidation cascade, the value of this classification becomes obvious. Consider three questions that aggregate data can't answer:
- Are high-PnL wallets reducing exposure before the flush? If Money Printer and Smart Money cohorts (wallets with +$100K to $1M+ in all-time profit) start pulling back on BTC exposure hours before the cascade, that's the strongest positioning signal available on-chain. These accounts have survived previous cascades precisely because they manage risk proactively.
- Which size cohorts are absorbing the forced selling? If the liquidations are concentrated in Fish ($250-$10K) and Dolphin ($10K-$50K) cohorts while Leviathan and Tidal Whale accounts hold steady or reduce exposure cleanly, the cascade is a retail shakeout. If Whale and Small Whale cohorts are getting hit too, the pain is broader.
- What's the leverage profile of the worst-performing cohorts? Full Rekt and Giga-Rekt wallets, accounts with the worst all-time track records, historically carry higher leverage and adjust more slowly during drawdowns. When you can see their exposure growing while better-performing cohorts de-risk, you're watching the setup for exactly the kind of cascade that played out on November 5-6.
The Pattern That Repeats Across Every Flush
The November 5-6 event wasn't unique. The same cohort dynamics play out across virtually every major liquidation cascade on Hyperliquid, and the pattern is remarkably consistent.
Wallets with strong track records tend to reduce exposure ahead of macro catalysts. They watch equity futures, monitor ETF flow patterns, and cut positions before the data prints. When Money Printer wallets reduce BTC exposure while Fish and Shrimp accounts are still adding to longs, that divergence is one of the most reliable warning signals available on any perp exchange.
Wallets with the worst track records tend to do the opposite. They add leverage during rallies, ignore macro signals, and end up as the liquidation fuel that accelerates every cascade. The Exit Liquidity, Semi-Rekt, Full Rekt, and Giga-Rekt cohorts don't just lose money more often. They lose money in the worst possible way: through forced liquidation at the bottom of a cascade, after smarter accounts have already exited.
Reading the Next Cascade Before It Happens
Every liquidation cascade follows the same basic recipe: a macro trigger, a spot selloff, leverage unwinding, and a feedback loop that amplifies the damage. The variable isn't the mechanics. It's the positioning going in.
If you're watching aggregate open interest decline and you think that's enough signal, you're operating with a fraction of the available data. Aggregate OI tells you leverage is unwinding somewhere. Cohort data tells you who is unwinding it, whether it's the smart money de-risking proactively or the overleveraged accounts getting forced out. Those are opposite signals packaged inside the same headline number.
The traders who navigated November 5-6 without eating a margin call share a common approach: they watched positioning data first and price second. By the time the $1.08 billion liquidation number hit your feed, the trade was already over. The question for the next cascade isn't if it's coming. It's whether you'll see the cohort data shifting before the headlines do.
See Who's Positioned Before the Next Flush
HyperTracker's API delivers cohort-level positioning data across all 16 behavioral segments on Hyperliquid. Track how Money Printer wallets, Leviathans, and every other cohort are positioned, with refreshes every 5 minutes. One API call, 16 cohorts, starting at $179/mo.