
The Five Builders Who Won Hyperliquid's Fee War in 2026
By CMM Team - 07-Nov-2026
The Five Builders Who Won Hyperliquid's Fee War in 2026
Hyperliquid's builder code program turned into a $90 million economy in its first two years, and by October 2026, the top builder alone had crossed $26.8 million in cumulative fees. But the real story isn't the total. It's the concentration. Five teams captured the overwhelming majority of revenue, while more than 1,400 other builder codes split the remainder. Figures from HyperTracker's builder leaderboard as of July 2026, supplemented with third-party reporting through October 2026.
The 2026 builder leaderboard reads like a case study in platform economics: wallet providers, trading bots, and analytics terminals all competing for the same pool of user-generated fees, each running a fundamentally different strategy. Some win on volume, others win on pricing power, and a few win on sheer user count. The gap between the winners and the long tail is staggering, and it keeps widening.
We pulled the full builder leaderboard from our API and combined it with public reporting to break down how the top five actually won, what their strategies reveal about DEX distribution, and why the fee split debate is heating up as we head into 2027.
The Leaderboard: Five Names, One Pattern
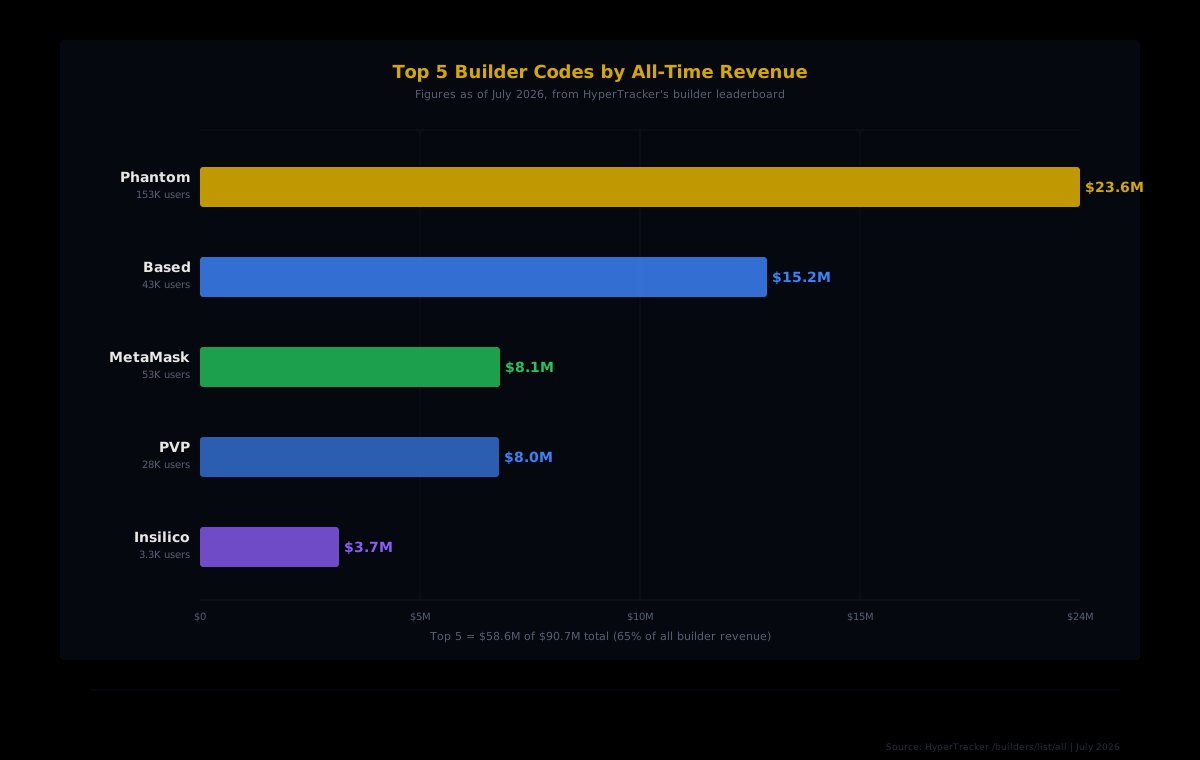
Our data from July 2026 tells a clear story about concentration. The top five builders accounted for roughly $58.6 million of the $90.7 million total, which means five teams captured about 65% of all builder revenue ever generated on Hyperliquid. By October, public reporting showed the top earners growing even faster.
| Rank | Builder | Revenue (July 2026) | Users | Volume | Joined | | --- | --- | --- | --- | --- | --- | | 1 | Phantom | $23.6M | 153,128 | $44.8B | Jun 2025 | | 2 | Based | $15.2M | 42,967 | $44.9B | Jun 2025 | | 3 | MetaMask | $8.1M | 52,534 | $9.0B | Aug 2025 | | 4 | PVP | $8.0M | 28,223 | $17.1B | Jul 2024 | | 5 | Insilico | $3.7M | 3,339 | $36.3B | Jul 2024 |
Phantom alone earned more than builders ranked 6 through 15 combined. That's a power-law distribution, exactly what you'd expect when distribution is everything, because the platform with the most existing users wins the most volume. Users rarely switch wallets just to reduce a 5 bps fee.
By October 2026, public reporting showed Phantom at $26.8 million and MetaMask at $11.89 million, confirming the gap between top and bottom was still widening. The rich-get-richer dynamic hasn't slowed down.
Three Business Models, One Leaderboard
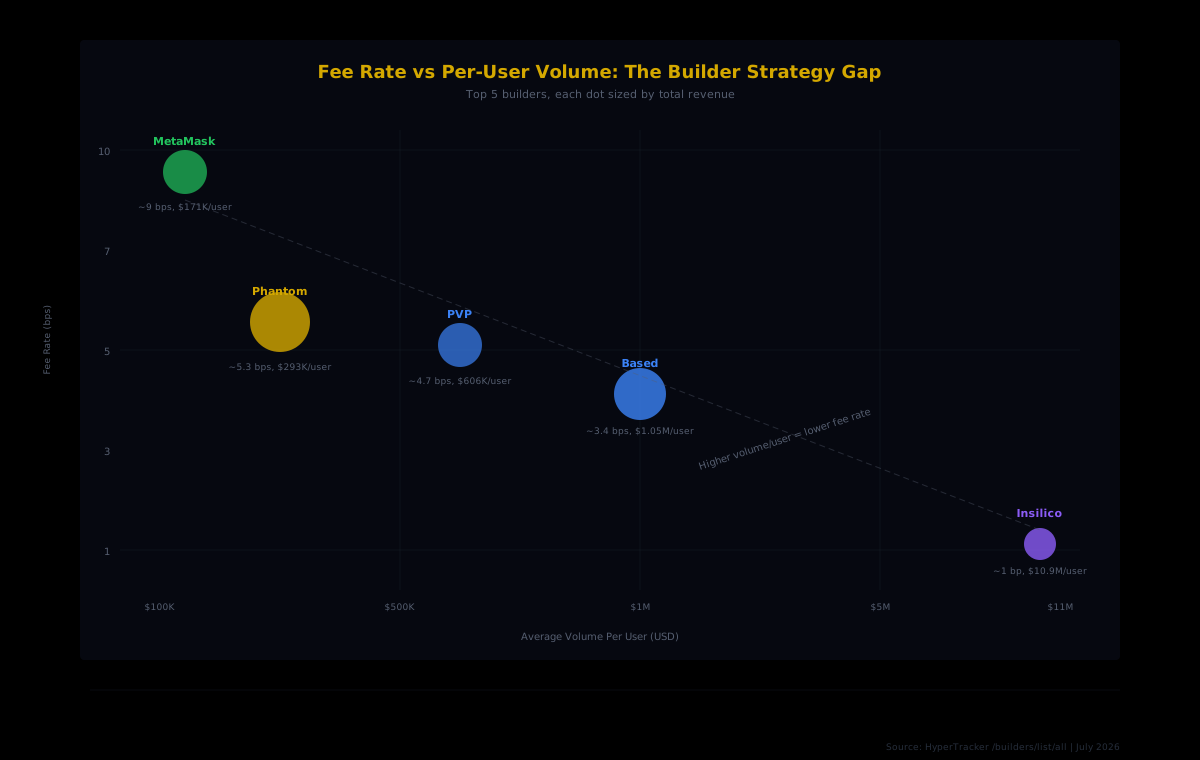
Revenue alone is misleading. Divide each builder's revenue by its volume and a very different picture emerges: these five teams are running fundamentally different businesses on the same protocol.
The wallet play: Phantom and MetaMask
Phantom and MetaMask are general-purpose wallet providers. Their edge is distribution. Phantom had 153,128 users in our July snapshot, MetaMask had 52,534. Users open their wallet, see Hyperliquid as a supported venue, and trade without ever visiting the native frontend. The trade is attributed to the wallet's builder code automatically.
MetaMask charges the highest effective rate among the top five at roughly 9 basis points per dollar traded, close to the 10 bps maximum for perps. Phantom runs at about 5.3 basis points. That pricing power comes from existing install bases. When you're the default wallet for millions of users, you don't compete on fee rate. You compete on convenience, and convenience commands a premium.
The terminal play: PVP and Based
PVP is a trading terminal. Based operates in a similar space. Both attract active traders who chose the product for its features, then accepted the builder fee as part of the package. Based is interesting: it routed $44.9 billion in volume (actually slightly more than Phantom) but earned $15.2 million versus Phantom's $23.6 million. The difference comes entirely from fee rate: Based charges roughly 3.4 basis points, about 36% less than Phantom's 5.3 bps.
That trade-off is intentional. Lower fees attract high-frequency traders who generate more volume per account, and Based's 42,967 users are clearly more active on average than Phantom's 153,128.
The algorithm play: Insilico
Insilico sits at the bottom of the top five in revenue ($3.7 million) but near the top in volume ($36.3 billion). With just 3,339 users, each Insilico user traded an average of $10.9 million. These are algorithmic traders and market makers operating at industrial scale, and they demand rock-bottom fees: roughly 1 basis point.
That 9x gap between MetaMask and Insilico isn't noise. It reflects the fundamental tension in fee-based distribution: casual users tolerate higher fees because they don't notice them, while professional traders negotiate fees down because every basis point hits their margin.
Revenue Per User: The Hidden Metric
User counts are vanity metrics unless you know what each user is worth. The revenue-per-user calculation reveals which builders have the stickiest, highest-value relationships.
From our July data, Mass (rank 12) led the entire top 15 at roughly $1,395 per user, followed by Insilico at $1,113. Both serve small, sophisticated user bases. Compare that with Phantom at $154 per user and MetaMask at $153, where the denominator is tens of thousands of users, most of whom trade smaller size and less frequently.
Axiom is a useful outlier to study. It ranks seventh in revenue ($2.4 million) with 34,093 users, putting it at around $69 per user. That's a broad distribution play: capture a large audience at a low fee rate and bet on long-term stickiness. Whether that bet pays off depends on how those users mature as traders.
The takeaway for builders: a thousand power users can generate more fee revenue than a hundred thousand casual ones, because builder fees scale linearly with volume, and volume concentrates in the hands of active traders.
The Long Tail: 1,400 Builders Splitting the Scraps
Behind the top 15 sit 1,396 other builder codes sharing roughly $15.5 million in revenue. That works out to about $11,000 per builder on average, though the actual distribution is far more skewed. Many earn close to nothing.
Registration requires just 100 USDC in a perps account, so the registry is full of experimental projects, abandoned bots, and personal-use codes. The real ecosystem is much smaller than 1,411 active participants. But this pattern isn't unique to Hyperliquid. App stores, affiliate programs, and marketplace ecosystems all follow the same shape: a small number of distributors capture the vast majority of value. The difference is that Hyperliquid's data is fully on-chain, so anyone can audit the concentration.
The Fee Split Debate
2026 brought a new dimension to the builder economy: controversy over how much builders should actually keep.
Builders keep up to half the trading fees from markets they operate, and as builder-run markets grew throughout the year, that revenue share came under scrutiny. Synthetix founder Kain Warwick put it bluntly: "The fact that Hyperliquid has landed on 50% of the fees is a bit crazy. I can't see how that's sustainable." He noted that Synthetix never paid outside market makers more than 30% of fees.
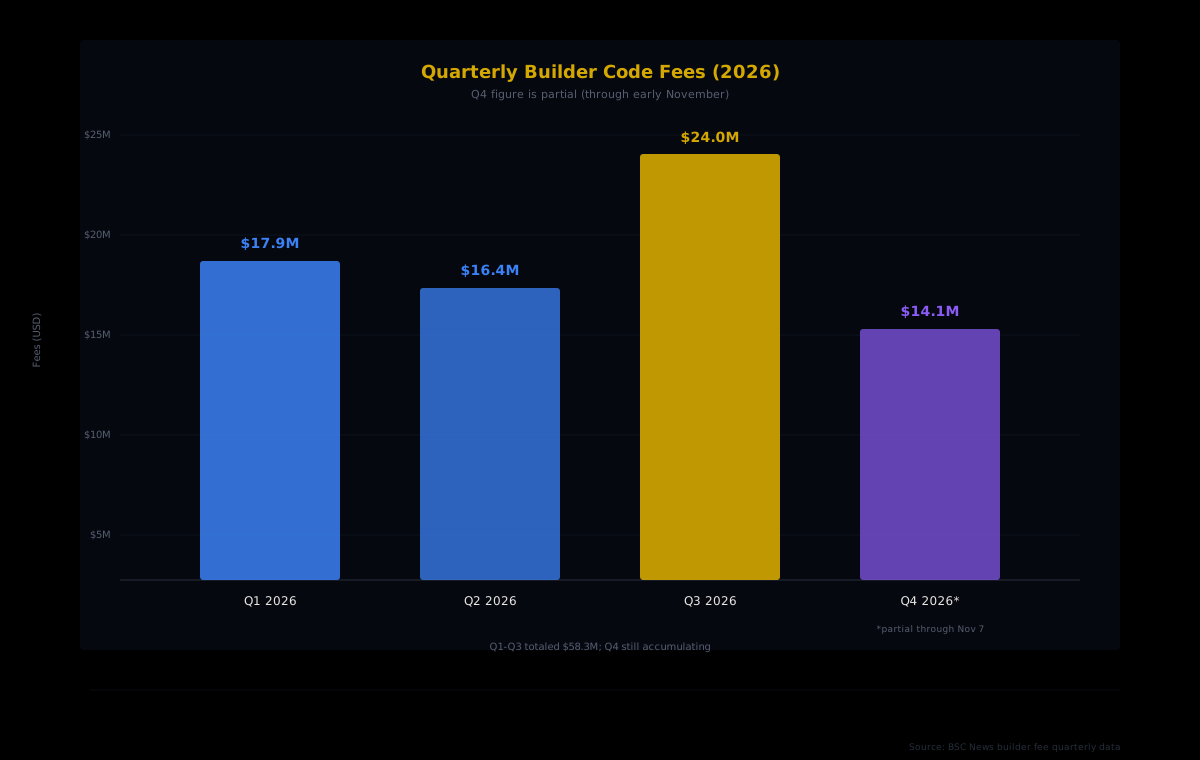
The criticism isn't abstract. Quarterly HYPE buybacks declined from roughly $290 million in Q3 2025 to about $149 million by Q2 2026, and critics linked the drop partly to how much revenue was flowing to builders rather than back to the protocol and token holders.
For builders, this creates a strategic risk. If Hyperliquid adjusts the fee split downward (Warwick called the current rate an "opening offer that probably is gonna change"), the revenue math for every builder code changes overnight. The highest-fee builders like MetaMask would feel the impact most, while low-fee algorithmic builders like Insilico are already operating at margins where a split adjustment matters less.
Lessons From the Fee War
After tracking builder code data through the full year, a few patterns hold up consistently:
Wallets win distribution. Phantom (rank 1), MetaMask (rank 3), and Rabby (rank 11) are all wallet providers. Between them, they routed over $60 billion in volume and earned more than $33 million in fees from our July snapshot alone. Being embedded in a user's daily workflow matters more than building a feature-rich standalone product.
Fee rate is a business model decision. The 9x gap between MetaMask (roughly 9 bps) and Insilico (roughly 1 bp) isn't a mistake, it's a deliberate choice based on user type. Consumer wallets charge more because their users accept it. Algorithmic platforms charge less because their users demand it. There's no single "right" fee rate, just different strategies for different audiences.
Volume concentration is extreme. Among Insilico's 3,339 users, average volume per user runs north of $10 million. Among Phantom's 153,128, it's closer to $293,000. Both are viable businesses, but they scale differently. A wallet needs to keep adding users. An algo platform needs to keep its power users happy.
The fee split is a variable, and it could change. Builders who plan assuming the current 50% split will persist indefinitely are making a bet. Builders who design products that are sticky regardless of fee economics are building something more durable.
Tracking Builder Performance With Our API
Every number from our data in this article came from a single API call to our builder analytics endpoint. HyperTracker's /builders/list endpoint returns the full leaderboard with revenue, user counts, volume, and join dates for every registered builder code on Hyperliquid.
If you're building on Hyperliquid, our data lets you benchmark your builder code against the ecosystem in real time. Track which builders are gaining or losing momentum across daily, weekly, monthly, and all-time timeframes. If you're a trader, it tells you which frontends route the most volume and at what fee rate, so you can make informed choices about which builder fees you approve.
Query the Full Builder Leaderboard
HyperTracker's API gives you programmatic access to builder code rankings, revenue breakdowns, and volume attribution across every registered builder on Hyperliquid.
Looking Toward 2027
The builder leaderboard will look different a year from now. HIP-3 (traditional asset perps) and HIP-4 (prediction markets) have introduced entirely new volume categories that builders can route through their codes. Hyperliquid also generated a record $521,000 in priority fees on November 5 alone, during a U.S. stock selloff, a sign that the protocol's overall fee generation keeps growing even as questions about the builder split persist.
The staking referral program will let builders and referrers who stake HYPE keep a percentage of their referred users' trading fees, up to 40% at the highest tier. That could significantly reshape the revenue math for top builders who also hold large HYPE positions.
But the structural dynamic from 2026 will likely carry forward: wallets win distribution, bots win volume efficiency, and fee strategy matters as much as user count. The builders who understood that earliest are the ones sitting at the top of the leaderboard today. For everyone else entering the ecosystem, the playbook is public, on-chain, and queryable. The five builders at the top figured that out early. Everyone else has the data to catch up.