1,411 Builders, 5 Winners: Inside Hyperliquid's Builder Code Leaderboard
By CMM Team - 27-Oct-2026
1,411 Builders, 5 Winners: Inside Hyperliquid's Builder Code Leaderboard
Hyperliquid's builder code program has crossed $100 million in total developer payouts. That number sounds like a rising-tide-lifts-all-boats story. It is anything but.
Our data from HyperTracker's builder leaderboard tells a sharper story. As of July 2026, 1,411 builders had registered codes, and the top five alone had earned roughly $58.6 million. That is about 65% of the $90.7 million in all-time revenue tracked at that point. The remaining 1,400+ builders split the rest. By August, the program crossed the $100 million mark, but the concentration pattern has only intensified. (All builder leaderboard figures below are from HyperTracker's July 2026 snapshot.)
This article breaks down the full leaderboard: who earns what, why the concentration is so extreme, and what the efficiency metrics reveal about different builder strategies.
How Builder Codes Work
Builder codes are Hyperliquid's on-chain attribution layer for third-party applications. When a user trades through an app (wallet, terminal, bot), the app attaches its builder code to the order. On every fill, HyperCore deducts a small fee and credits it to the builder. Settlement is on-chain with one-block finality.
The fee parameter f is expressed in tenths of a basis point. A value of f=10 equals 1 basis point (0.01%), while f=100 reaches the maximum of 10 basis points (0.10%) for perpetuals. Spot trades allow up to 100 basis points (1.00%). These fees are additive: they stack on top of Hyperliquid's standard trading fees, so the builder earns without competing against the protocol for revenue.
Users must explicitly approve a maximum builder fee per builder address via the ApproveBuilderFee action, signed by their main wallet. Each user can hold a maximum of 10 active builder code approvals at a time, and they can revoke permissions whenever they want. The consent model is explicit and on-chain.
The barrier to entry is low: 100 USDC in a perpetuals account. No application process, no approval committee. A solo developer with a Telegram bot can integrate the same day as a company like Phantom.
The Top 10: Where the Fees Actually Go
The leaderboard is dominated by a handful of names. Here is the all-time top 10 from our builder analytics, ranked by revenue.
| Rank | Builder | Revenue | Volume | Users | Joined | | --- | --- | --- | --- | --- | --- | | 1 | Phantom | $23.6M | $44.8B | 153,128 | Jun 2025 | | 2 | Based | $15.2M | $44.9B | 42,967 | Jun 2025 | | 3 | MetaMask | $8.1M | $9.0B | 52,534 | Aug 2025 | | 4 | PVP | $8.0M | $17.1B | 28,223 | Jul 2024 | | 5 | Insilico | $3.7M | $36.3B | 3,339 | Jul 2024 | | 6 | Infinex | $2.8M | $5.2B | 9,283 | Aug 2025 | | 7 | Axiom | $2.4M | $23.0B | 34,093 | Jan 2025 | | 8 | TreadFi | $2.2M | $11.1B | 4,835 | Apr 2025 | | 9 | Dreamcash | $1.8M | $7.6B | 11,215 | Jun 2025 | | 10 | Liquid | $1.5M | $3.2B | 9,499 | Jun 2025 |
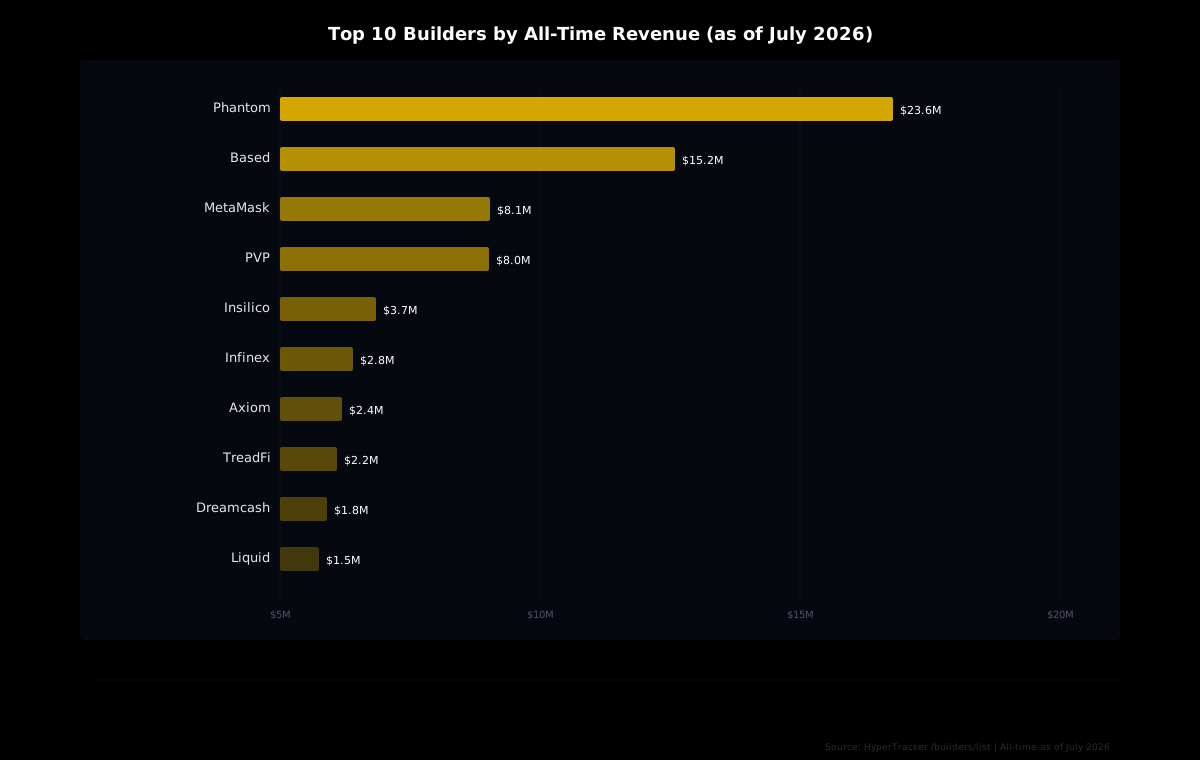
Phantom and Based sit at the top with remarkably similar volume ($44.8B and $44.9B respectively), but Phantom earns significantly more revenue because it routes 153,128 users versus Based's 42,967. More users, similar volume, higher total fees. Distribution matters.
The Concentration Problem
The top five builders (Phantom, Based, MetaMask, PVP, and Insilico) have collectively earned roughly $58.6M of the total $90.7M in all-time builder revenue. That is about 65% of the entire pool going to fewer than 0.4% of registered builders.
This concentration is not an accident. It reflects a fundamental reality of distribution economics: the builders who earn the most are the ones who already had users before they integrated Hyperliquid. Phantom did not build a new user base for perps trading. It already had millions of wallets across Solana and other chains. Adding Hyperliquid was a feature update, and each existing user became a potential perps trader without installing another app.
MetaMask followed the same playbook. With its installed base across Ethereum and EVM chains, plugging into Hyperliquid via a builder code turned a wallet into a perps frontend overnight. The fee revenue (over $8 million) came from distribution that was already in place.
For newer builders without existing distribution, the math is harder. The bottom 1,400+ builders share roughly $32 million in total revenue. That is about $22,800 per builder on average, though the median is almost certainly much lower given the long-tail shape of the distribution.
Revenue Per User: Where Efficiency Wins
Raw revenue totals tell one story. Revenue per user tells another.
Mass, ranked 12th by total revenue with $1.5M, has only 1,054 users. That works out to roughly $1,394 per user, the highest efficiency metric in the top 15. Insilico follows at $1,113 per user, with just 3,339 users generating $3.7M in revenue.
Contrast that with Phantom. Its $23.6M in revenue divided across 153,128 users comes out to about $154 per user. Axiom is even lower at roughly $69 per user, despite processing $23 billion in volume.
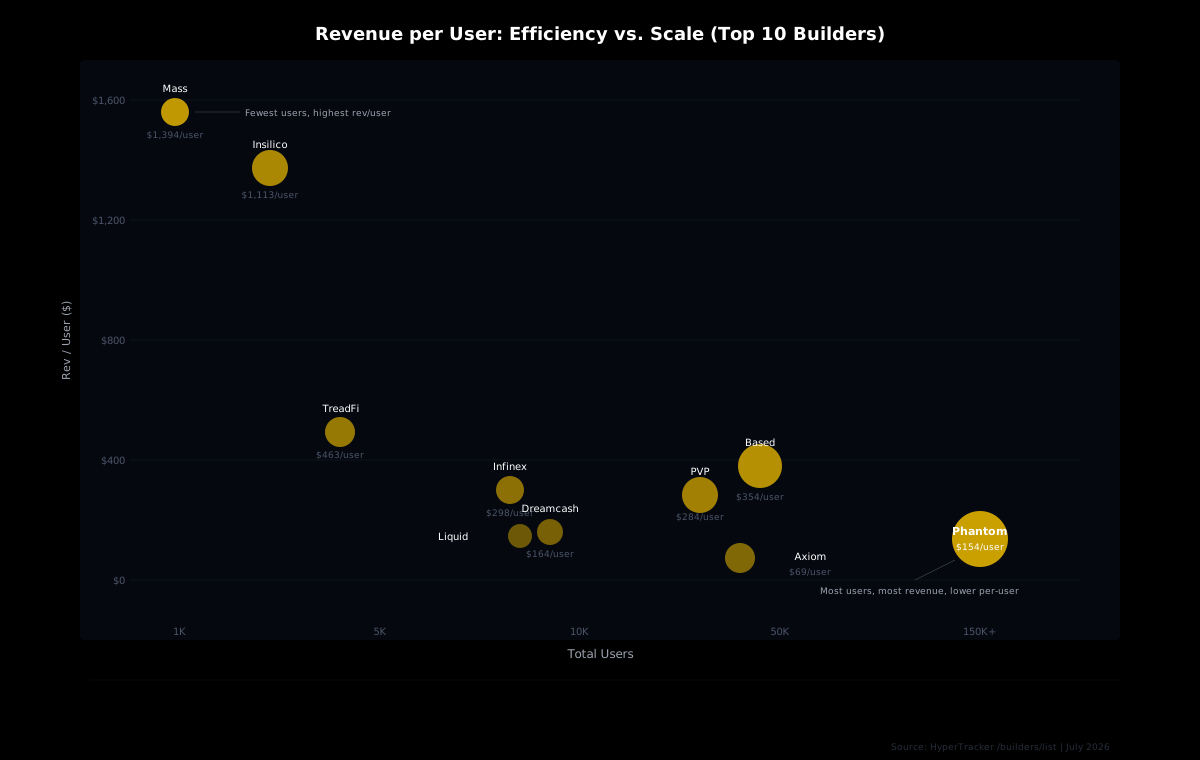
The lesson is straightforward. High-volume, high-user-count builders (wallets, aggregators) win on scale. Low-user-count builders (specialized terminals, institutional tools) can still earn meaningful revenue if their users trade large and trade often. Both strategies work, but they require different moats: distribution for the first, stickiness and per-user depth for the second.
Four Builder Categories, Four Revenue Profiles
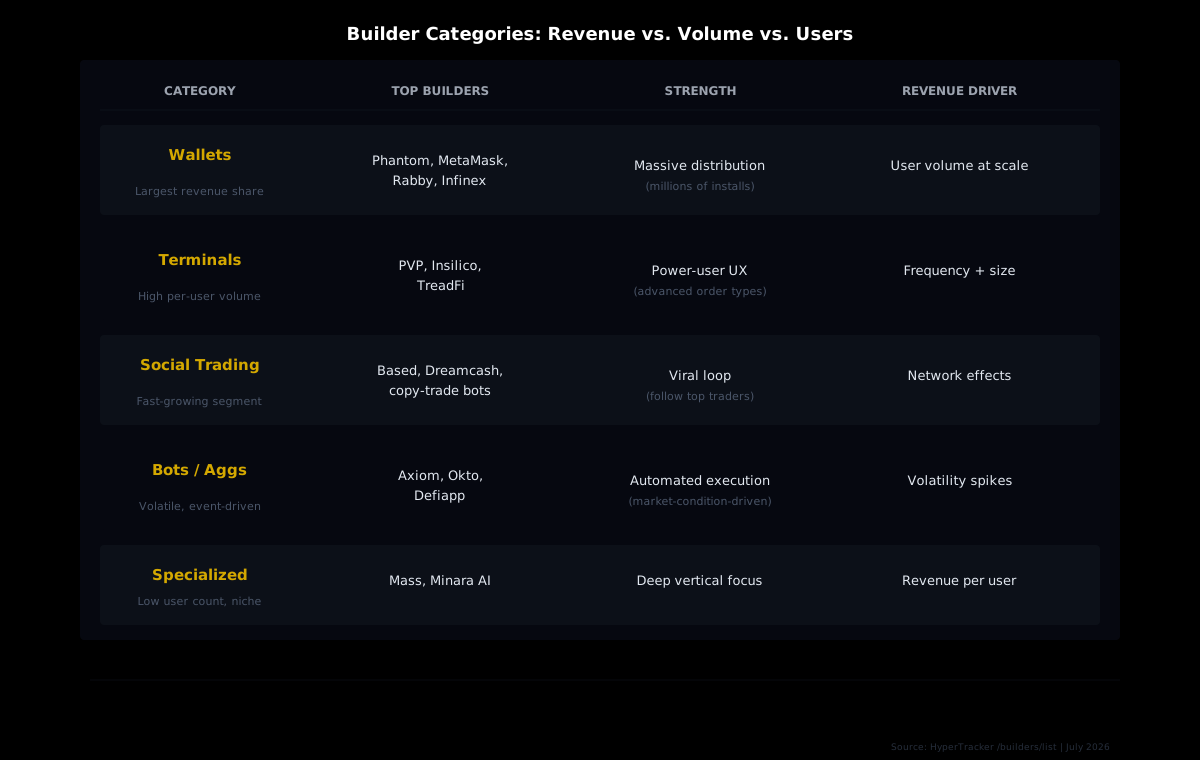
The builder ecosystem breaks into four broad categories, each with distinct revenue characteristics.
Wallets
Phantom, MetaMask, Rabby ($1.5M), and Infinex represent the wallet category. Their strength is distribution: they are already installed on millions of devices. When they add Hyperliquid support, every existing user becomes a potential perps trader. Wallets capture the largest share of total builder revenue because volume scales linearly with user base.
Trading terminals
PVP, Insilico, and TreadFi attract power users who value advanced order types, better charting, and faster execution. These builders have smaller user bases but higher per-user volume. Insilico, for example, processes $36.3B in volume from just 3,339 users, which means its average user generates over $10 million in lifetime volume. That kind of per-user depth is hard to replicate.
Social and copy trading
Based ($15.2M) and Dreamcash ($1.8M) lead the social trading segment. These platforms let users follow and mirror top traders, routing every copy-trade through a builder code. The revenue model benefits from network effects: the more profitable traders on the platform, the more copiers follow, and the more volume flows through the code. Based's $15.2M makes it the second-highest earning builder overall, proof that social distribution can compete with wallet-scale distribution.
Bots and aggregators
Axiom ($2.4M), Okto ($790K), and Defiapp ($780K) serve automated strategies and DEX aggregation. Revenue in this category tends to be more volatile, spiking during periods of high market activity and tapering during quieter stretches. But during volatility events, bot volume can surge dramatically, which makes this category attractive for builders who can weather the dry spells.
Volume Does Not Equal Revenue
One of the more counterintuitive patterns in the data: volume and revenue do not correlate as cleanly as you might expect.
Axiom has processed $23.0B in all-time volume but earned only $2.4M in fees. That is roughly 1 basis point per dollar traded. Meanwhile, MetaMask processed $9.0B in volume but earned $8.1M, which works out to about 9 basis points per dollar. The fee rate that a builder sets (or that its users accept) matters enormously. Two builders can process similar volume and earn vastly different revenue depending on where they set f.
This is why comparing builders by volume alone is misleading. A builder routing $50 billion at 1 basis point earns $5 million. A builder routing $10 billion at 9 basis points earns $9 million. Fee strategy is as important as volume strategy, because the user's willingness to pay a higher builder fee depends on the perceived value of the frontend experience.
Tracking the Leaderboard
Several tools provide visibility into builder code economics:
- HyperTracker's builder analytics (coinmarketman.com/hypertracker) tracks builder revenue, volume, users, and per-user efficiency metrics via our
/builders/listAPI endpoint. - ASXN HyperScreener tracks fees, volume, and users per builder code across the ecosystem.
- HypeBuilders provides detailed builder code analytics and historical data.
- Flowscan offers a blockchain explorer view with builder code attribution.
Hyperliquid publishes daily trade data in compressed LZ4 format through its stats endpoint, which includes builder code attribution for every fill. This raw data powers most third-party dashboards and allows builders to independently verify their revenue.
For builders who want programmatic access: HyperTracker's API exposes the full builder leaderboard via the
/builders/listendpoint, including revenue, volume, user counts, and per-user metrics across all-time and rolling time windows. Pulse plans start at $179/mo with 50K requests/month.
What This Means for New Builders
The builder code leaderboard makes one thing clear: the program rewards distribution above all else. Phantom did not win because it built a better trading interface. It won because it already had 153,000+ users who could trade Hyperliquid perps without switching apps.
For new builders entering the ecosystem, the playbook depends on the category. Wallet integrations need existing install bases. Trading terminals need features that power users will pay a premium for (and "premium" here means tolerating a higher builder fee in exchange for better UX). Social platforms need a viral loop that attracts both skilled traders and copiers. Bots need to deliver consistent alpha during volatile markets.
The low barrier to entry (100 USDC) means anyone can integrate. But the leaderboard's concentration tells you that integration is the easy part. Distribution is the hard part, and it is the part that determines whether a builder earns $1,000 or $10 million.
Track Builder Code Performance with HyperTracker
Our builder analytics API gives you real-time access to the full leaderboard: revenue, volume, users, and per-user efficiency metrics for every builder on Hyperliquid.
Explore the Builder Leaderboard
The $100 million milestone proves that Hyperliquid's builder code model works. Developers get paid for routing volume. The protocol gets distribution without spending on marketing. Users get more frontend options. But the question every new builder should ask before integrating is simple: where are my users coming from? The code is easy. The users are hard.