
One Hyperliquid Builder Earns $1,395 Per User. Another Earns $91.
By CMM Team - 22-Oct-2026
One Hyperliquid Builder Earns $1,395 Per User. Another Earns $91.
Figures as of July 2026, from our builder leaderboard.
Hyperliquid's builder code program has distributed over $90.7 million across 1,411 builders . That top-line figure sounds impressive until you realize it hides one of the most lopsided distributions in DeFi. One builder earns roughly $1,395 for every user it onboards. Another brings in $91 . Both are in the top 15. Both are "successful" by any conventional metric. But the economics of their builder codes could not be more different, and the gap reveals something important about what actually drives revenue on a perp DEX.
Builder code revenue is a proxy for user quality, not user quantity. The builders who earn the most per user are not the ones with the biggest audiences. They are the ones whose users trade the most volume with the highest frequency.
This article breaks down how builder code revenue works on Hyperliquid, what separates high-RPU (revenue per user) builders from low-RPU ones, and how you can use our builder analytics to evaluate any builder code before you integrate it or sign up under it.
How builder code economics work on Hyperliquid
Hyperliquid's builder code system is straightforward. A builder registers a referral code. Users who trade through that code generate fees, and a portion of those fees flows back to the builder as revenue. The more volume a user generates, the more the builder earns from that user.
This creates a direct link between user trading behavior and builder economics. A builder code attached to 100 heavy futures traders will generate dramatically more revenue than a code attached to 10,000 users who signed up, placed one trade, and never came back. The mechanism rewards retention and activity, not just acquisition.
That is why aggregate revenue figures are misleading without context. Imagine a builder reporting eight figures in total revenue that looks like it is outperforming one in the low seven figures. But if the larger builder has tens of thousands of users and the smaller one has roughly a thousand, the smaller builder is extracting far more value per user.
The revenue per user leaderboard
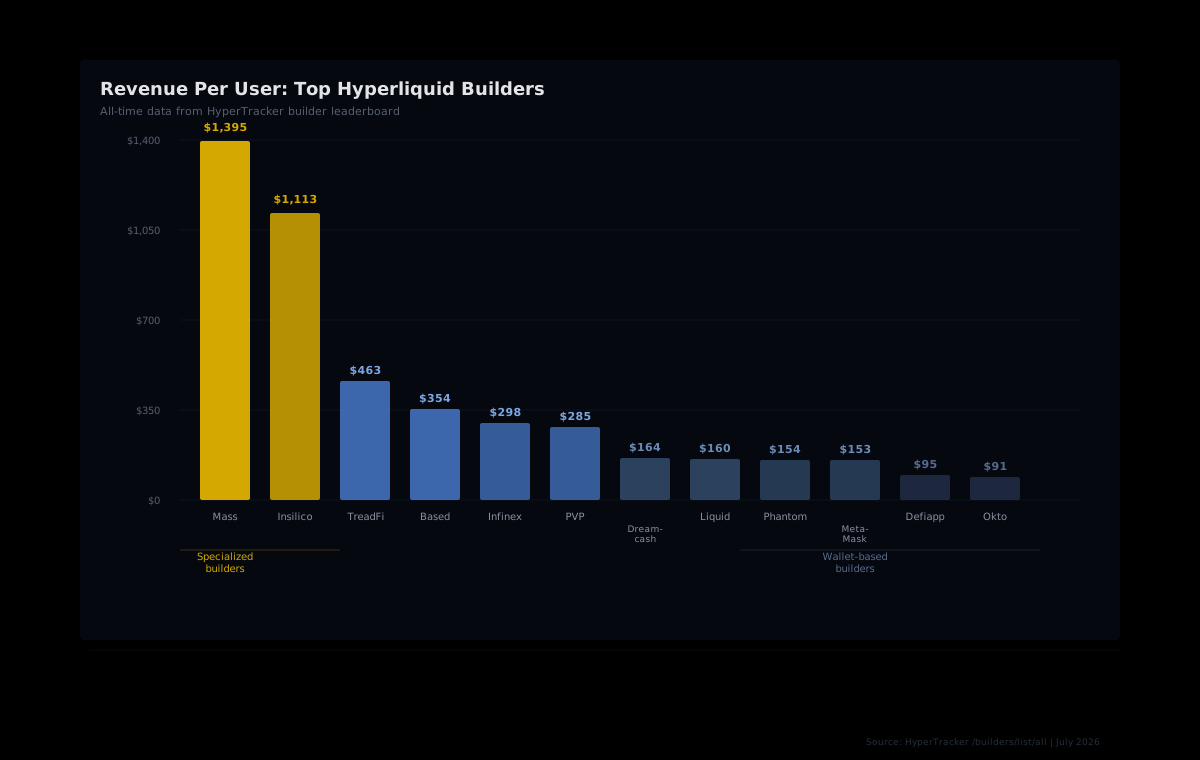
Here is what the top 15 builders look like when you sort by revenue per user instead of total revenue. The numbers come from our builder leaderboard endpoint, pulled from all-time data.
| Builder | Revenue | Users | Revenue/User | Volume | | --- | --- | --- | --- | --- | | Mass | $1.47M | 1,054 | $1,395 | $2.5B | | Insilico | $3.72M | 3,339 | $1,113 | $36.3B | | TreadFi | $2.24M | 4,835 | $463 | $11.1B | | Based | $15.2M | 42,967 | $354 | $44.9B | | Infinex | $2.77M | 9,283 | $298 | $5.2B | | PVP | $8.03M | 28,223 | $285 | $17.1B | | Dreamcash | $1.84M | 11,215 | $164 | $7.6B | | Liquid | $1.52M | 9,499 | $160 | $3.2B | | Minara AI | $775K | 4,933 | $157 | $2.6B | | Phantom | $23.6M | 153,128 | $154 | $44.8B | | MetaMask | $8.06M | 52,534 | $153 | $9.0B | | Defiapp | $780K | 8,183 | $95 | $5.5B | | Okto | $790K | 8,702 | $91 | $3.7B | | Rabby | $1.47M | 19,031 | $77 | $6.5B | | Axiom | $2.37M | 34,093 | $69 | $23.0B |
The range is striking. Mass generates $1,395 per user . Axiom generates $69 . That is a 20x gap between builders who are all in the top 15 by total revenue. And it tells a story that total revenue rankings completely obscure.
What drives high revenue per user
Three factors separate high-RPU builders from low-RPU ones: user type, volume concentration, and retention depth.
User type matters more than user count
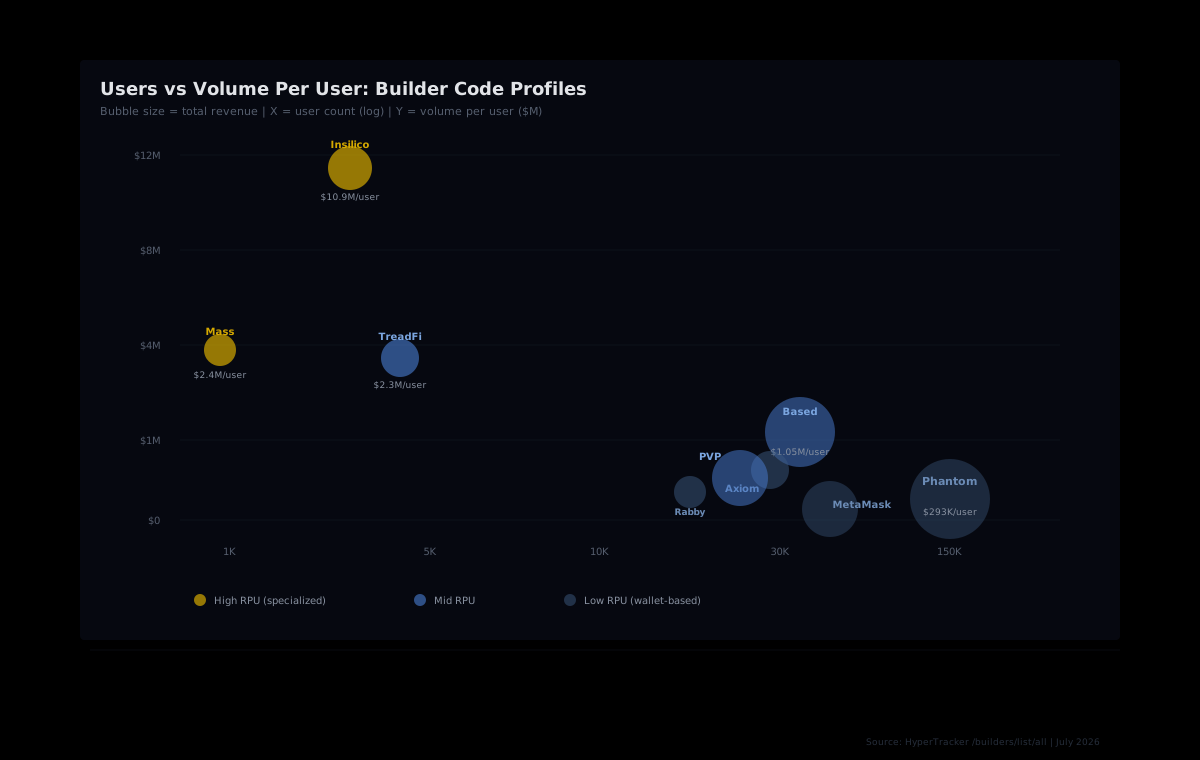
Look at Insilico. It has only 3,339 users but generates $3.72 million in revenue on $36.3 billion in volume. That is $10.9 million in volume per user. These are not casual traders. They are high-frequency, high-volume accounts that churn through positions constantly. Insilico's user base is small but hyperactive, which is exactly the profile that maximizes builder code revenue.
Compare that to Phantom. It has 153,128 users and leads the total revenue chart at $23.6 million . But its volume per user is around $293,000 , a fraction of Insilico's. Phantom's strength is distribution. It is a wallet, so it captures users at the point of entry. Many of those users are low-frequency or inactive, which dilutes the per-user economics even though the aggregate is enormous.
Volume concentration reveals operational leverage
Mass has the smallest user base in the top 15 at just 1,054 users , but those users generate $2.5 billion in volume. That is $2.4 million in volume per user, which translates into $1,395 in revenue per user. This kind of concentration usually signals either an institutional client base or a product that attracts professional-grade traders. Either way, it means Mass has operational leverage: fewer users to support, higher revenue per head.
The opposite pattern shows up with wallet-based builders like Rabby (19,031 users, $77 per user) and Axiom (34,093 users, $69 per user) . Their user bases are large because the builder code is baked into a product that lots of people use. But the vast majority of those users are not heavy perp traders. They might use the wallet for spot swaps and never touch perps, which means the builder code captures the sign-up but not the volume.
The wallet trap: big distribution, diluted economics
Phantom and MetaMask are the two largest builders by user count. Phantom has 153,128 users . MetaMask has 52,534 . They are also among the lowest in revenue per user at $154 and $153 respectively.
This is not a failure. It is a structural feature of wallet-level distribution. When every user who connects a specific wallet to Hyperliquid automatically registers under that builder code, the denominator grows with every connection, regardless of whether the user ever trades a perpetual. Wallets are general-purpose tools, so their user base includes spot traders, NFT buyers, DeFi yield farmers, and people who connected once to claim an airdrop and never came back.
The result is that wallet builders dominate total revenue (Phantom at $23.6 million leads the entire ecosystem) but trail in per-user efficiency. This matters if you are evaluating builder codes as a business model rather than a vanity metric. A builder that generates $154 per user needs to acquire roughly nine times as many users as one generating $1,395 per user to match the same revenue on a per-user cost basis.
Specialized builders punch above their weight
The high-RPU builders share a common trait: specificity. They are not general-purpose onramps. They serve a narrow audience that trades frequently and in size.
TreadFi at $463 per user and Based at $354 both sit in this middle zone. They have meaningful user bases (4,835 and 42,967 respectively) but their users trade enough volume to keep per-user economics healthy. Based is particularly interesting because it has nearly 43,000 users and still maintains $354 per user, suggesting that its user acquisition channels are pulling in active traders rather than passive signups.
Insilico and Mass represent the extreme end, where a tiny user base of professional traders generates outsized revenue. These builders are essentially B2B products serving institutional or algorithmic clients, where a single user might run multiple bots executing thousands of trades per day.
The takeaway for builders: if your builder code is attached to a broad consumer product, expect wallet-level RPU in the low hundreds or below, based on what we see from wallet builders in our leaderboard. If it is attached to a trading-specific tool or an institutional interface, the per-user figures in our data run several times higher. Both can be viable businesses, but they require completely different growth strategies.
How to track builder code performance with our data
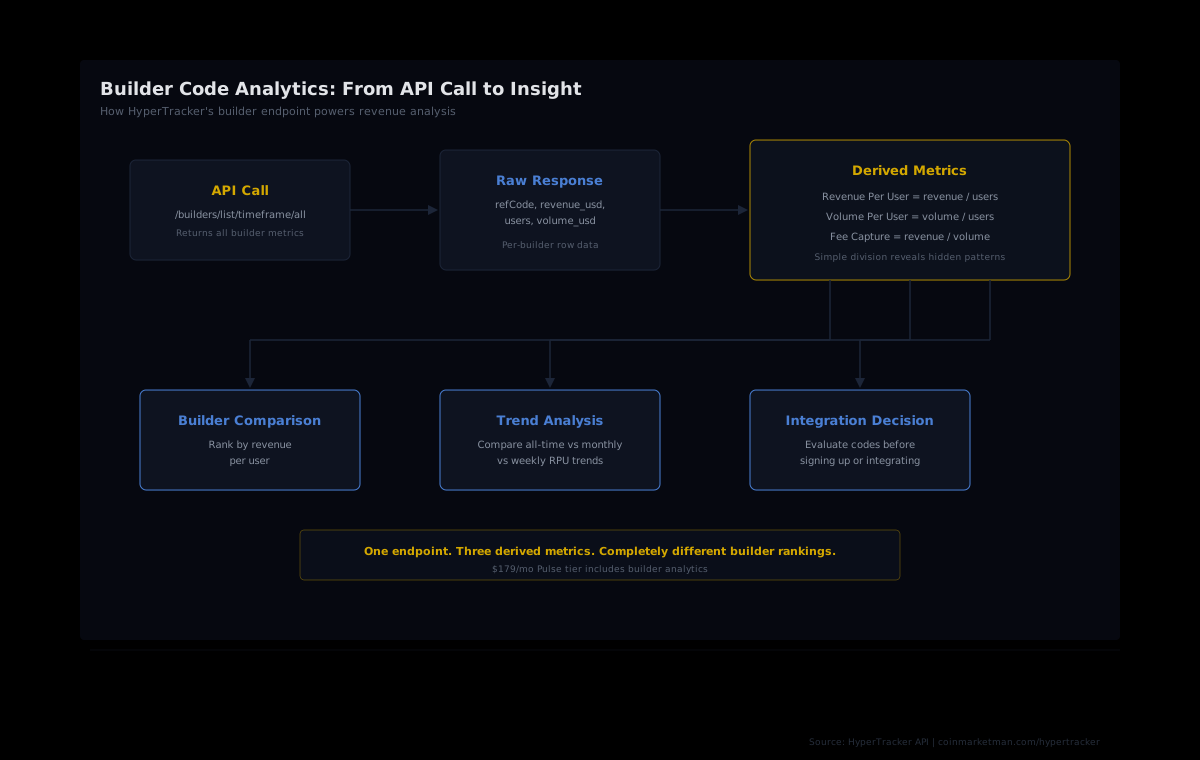
Our builder leaderboard endpoint (/builders/list) returns real-time rankings across multiple timeframes: all-time, monthly, weekly, and daily. Each record includes the builder's referral code, total revenue, user count, and volume, which is everything you need to calculate revenue per user and volume per user.
Here is a basic API call that returns the all-time builder leaderboard:
curl -H "Authorization: Bearer YOUR_TOKEN" \
  "https://ht-api.coinmarketman.com/api/external/builders/list/timeframe/all"
The response includes every builder code with its cumulative metrics. From there, the derived metrics are straightforward division:
- Revenue per user:
revenue_usd / users - Volume per user:
volume_usd / users - Revenue per dollar of volume:
revenue_usd / volume_usd(fee capture rate)
You can also compare across timeframes. A builder with high all-time RPU but declining monthly RPU might be losing its most active users. One with rising weekly RPU might be onboarding a new cohort of heavy traders. The delta between timeframes is often more informative than any single snapshot.
What this means for traders choosing a builder code
If you are a trader deciding which builder code to use, these numbers should matter to you for a different reason. Builder codes with high RPU tend to serve active traders, which means the builder has an incentive to keep building tools, improving UX, and retaining that user base. A builder earning $1,395 per user can justify investing heavily in its product. A builder earning $69 per user with over 34,000 users is playing a volume acquisition game where individual user experience is less of a priority.
This is not always true (some low-RPU builders are excellent products), but as a heuristic, the RPU of a builder code tells you something about how much that builder values your trading activity specifically. Higher RPU usually correlates with better tooling, faster support, and more trading-focused features.
The 15x gap is the real story
Total revenue rankings are the default way people evaluate builder codes. They are also the least informative. Phantom leads with $23.6 million and Mass sits at $1.47 million , which makes Phantom look like the clear winner by every conventional measure. But Mass earns $1,395 per user while Phantom earns $154 . Mass extracts nine times more value from each user relationship. And Insilico, with its $1,113 per user and just 3,339 users , generates more revenue per head than any wallet-based builder in the top 10.
The gap between these numbers is the gap between distribution-led growth and product-led monetization. Wallets win on distribution. Specialized tools win on per-user economics. Knowing which game a builder is playing, and which game you want to play, is the first step toward making builder code analytics actually useful.
Track builder code economics in real time
Our builder leaderboard API gives you revenue, user count, and volume for every builder code on Hyperliquid across all-time, monthly, weekly, and daily timeframes. Calculate RPU, spot trends, and evaluate any code before you integrate or sign up.