
Bitcoin Volatility Hit a Floor. Here's What Perp Traders Do Next
By CMM Team - 21-Oct-2026
Bitcoin Volatility Hit a Floor. Here's What Perp Traders Do Next
Bitcoin has been sitting between $80,000 and $84,000 for over a week, and for perp traders, the silence is louder than any liquidation cascade. Deribit's DVOL index closed at 37.33 on October 19, the lowest 30-day implied volatility reading since March 2021. The options market is barely breathing. Perpetual funding sits at 0.0035% per eight hours, which annualizes to under 4%. And the realized volatility over the last two weeks has collapsed to just 20.2% annualized, the lowest reading in 45 days.
This is the kind of environment that separates traders who adapt their playbook from the ones who keep forcing directional bets into a market that refuses to move.
Compressed volatility is a signal. It changes which strategies work, which ones bleed, and which ones print. This piece breaks down the current regime, walks through the three perp strategies best suited to it, and shows how behavioral cohort data can tell you which approach to favor before the next move arrives.
The Volatility Compression, by the Numbers
Start with the headline figure: Bitcoin's DVOL, Deribit's forward-looking 30-day implied volatility index, dipped to 37.33 on October 19. That reading sits below 92% of all days since March 2021, which means options market makers are pricing in one of the quietest months in five and a half years.
But the options market is actually being generous. The 14-day realized volatility, what price has actually done over the past two weeks, printed at just 20.2% annualized. That translates to roughly 1.06% of movement on an average day. A DVOL of 38.3% corresponds to about 2.0% of expected daily movement, so options sellers are pricing in nearly double the volatility that has actually materialized.
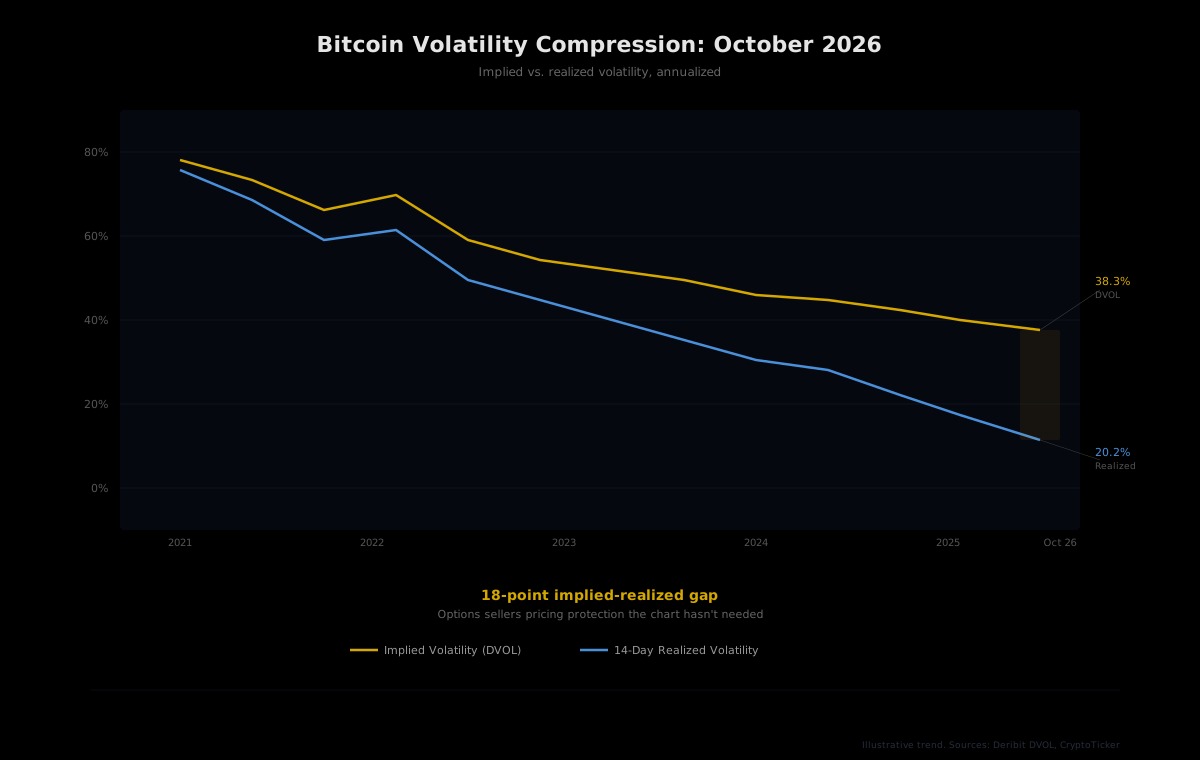
This gap, roughly 18 percentage points between implied and realized, tells you something important. Protection is still expensive relative to the actual risk. Options sellers are comfortable with the quiet, but they're not giving premium away, because they know compressed volatility doesn't last forever.
Zooming out makes the structural shift clearer. Bitcoin's realized volatility over the past year has dropped to 43%, below both the 10-year average of 64% and the 5-year average of 81%, according to Grayscale and Bloomberg data as of October 6. Bitcoin's market volatility is now lower than that of 19% of S&P 500 components. This isn't a one-week anomaly. Institutional adoption through spot ETFs and corporate treasuries has structurally dampened how wild BTC swings.
Why Volatility Compression Kills the Default Playbook
Most perp traders default to directional bets. Long with leverage, short with leverage, set a stop, ride the move. That playbook prints when volatility is expanding, because a 5x long on BTC during a week with 4% daily swings has room to run. In a week where daily range collapses below 1%, the same 5x long just bleeds funding and chops between your stop and your entry.
The numbers make this stark. At current 14-day realized vol of 20.2%, a daily expected range of about 1% means a leveraged directional trade needs to nail the direction almost perfectly to overcome funding costs and fees. Miss it by a fraction, and the position erodes.
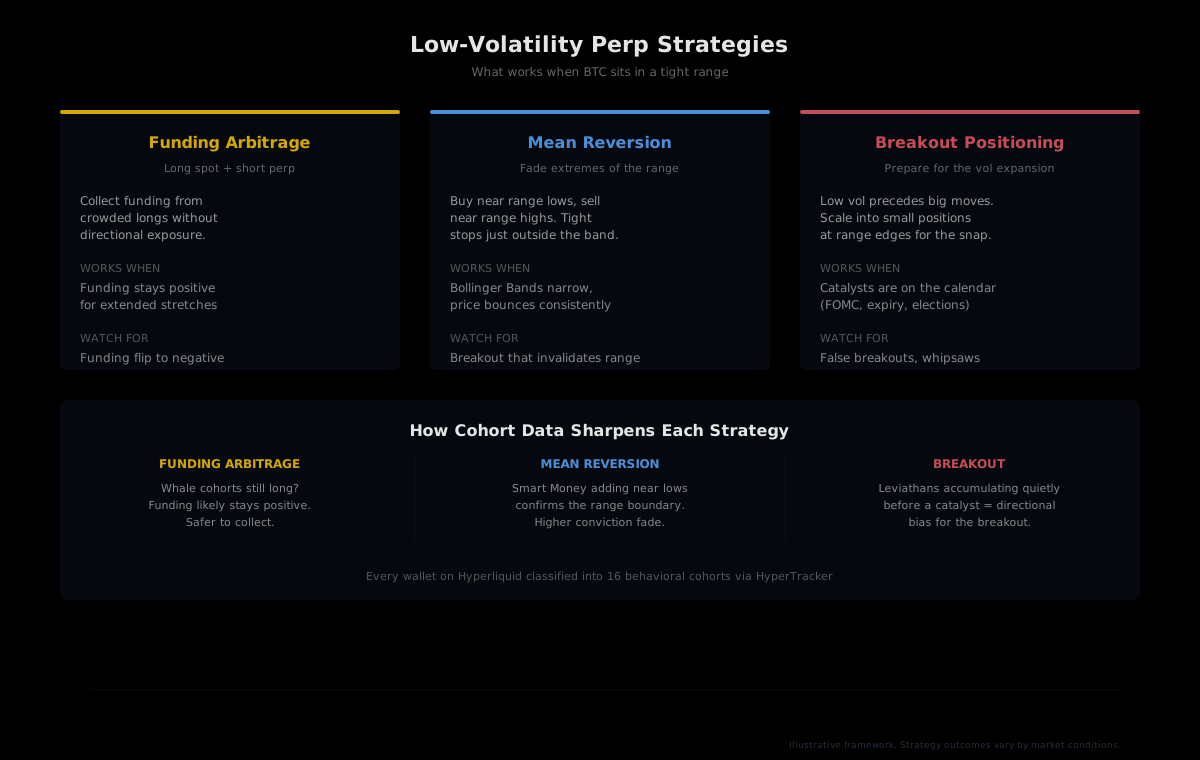
Low volatility environments don't reward conviction. They reward structure. The three strategies that thrive in compression share a common trait: they all profit from the range continuing, collect from other traders who are positioned wrong, or position cheaply for the inevitable breakout.
Strategy 1: Funding Rate Arbitrage
When volatility compresses and price goes sideways, funding rates tend to stay low but positive. As of mid-October, BTC perp funding on major venues is running at roughly 0.0035% per eight hours, which annualizes to about 3.87%. That's below the long-run average of around 8.4% annualized, but it's steady.
The classic delta-neutral setup: buy spot BTC, short the same notional in perpetual futures, and collect the funding payments that longs pay to shorts. Price moves cancel out because your net exposure is zero. Your P&L comes entirely from the funding rate differential.
The catch, and it's worth stating plainly: at current rates, the annualized return on this trade is compressed compared to early 2026 when funding ran much hotter. Trading costs (exchange fees, slippage on entry and exit, capital opportunity cost) eat into the net yield. This strategy works best when you can hold it patiently and when you have reason to believe funding won't flip negative for an extended period.
Where cohort data helps: If the larger cohorts on Hyperliquid, think Whales and Leviathans, are still net long, that structural demand supports positive funding. If they start unwinding, funding could flip. Our cohort positioning data shows which side the biggest wallets are on before the aggregate number catches up.
Strategy 2: Range-Bound Mean Reversion
BTC has spent the past week bouncing between $80,000 and $84,000. Bollinger Bands have squeezed to approximately 6.5% of price, among the tightest readings in two and a half years. When bands compress this tightly, mean reversion setups, buying near the range floor and selling near the ceiling, have a higher hit rate because price keeps bouncing within defined walls.
The execution is straightforward: enter long near the bottom of the established range, set a take-profit near the top. Enter short near the top, set a take-profit near the bottom. Keep stops tight just outside the range edges, because when this band finally breaks, it breaks hard.
The discipline requirement is real. Mean reversion works until it doesn't, and the transition from range-bound to trending can happen on a single candle. That's why the strategy needs strict invalidation levels. If price closes outside the range on volume, the thesis is dead.
Where cohort data helps: When Smart Money cohorts (wallets with +$100K to +$1M all-time PnL) add positions near the range floor, that's confirmation that experienced wallets see the level as support. If they're quiet or reducing at that same level, the range may be about to give way.
Strategy 3: Breakout Positioning (The Volatility Expansion Bet)
Here's the thing about compressed volatility: it always resolves. Every period of extreme quiet in BTC's history has been followed by a large move, and the tighter the compression, the more violent the expansion tends to be. Past low-volatility conditions like the current one have preceded 30% swings in either direction within a few months.
Breakout positioning means building small, defined-risk positions at range extremes before the catalyst arrives. The key word is small, because timing the breakout is nearly impossible and whipsaws are common in late-stage compression.
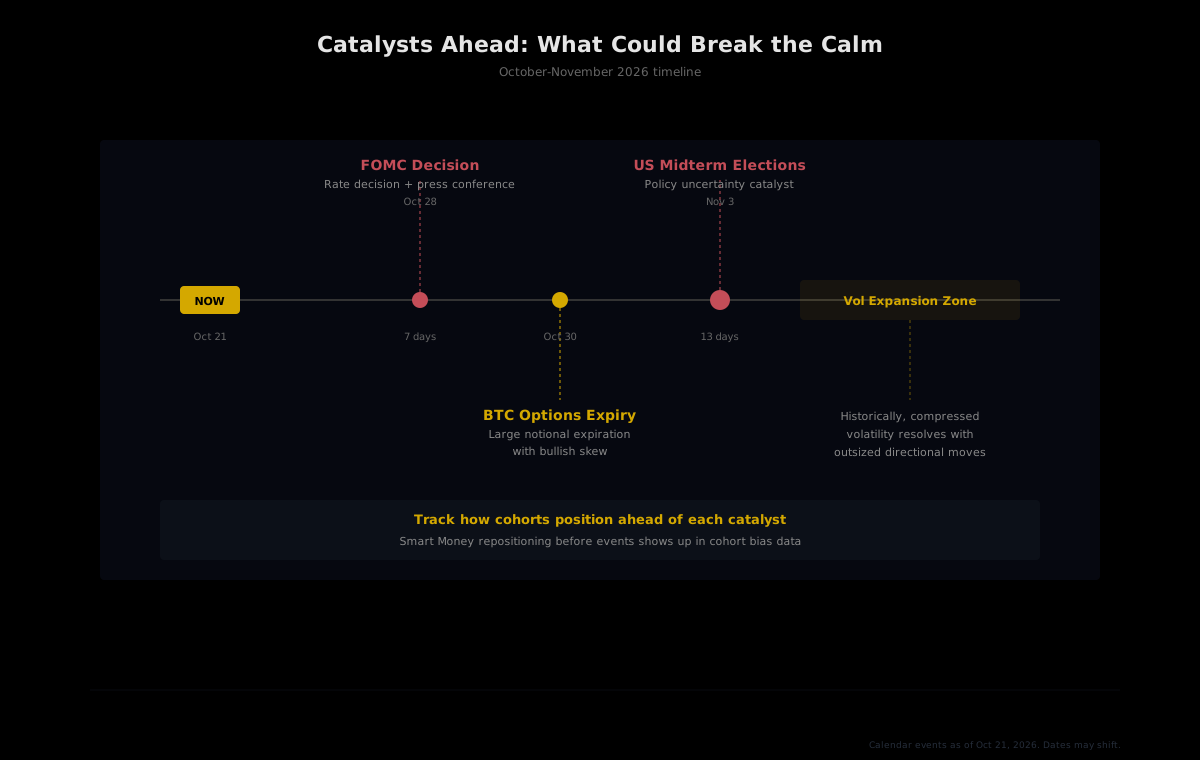
The catalyst calendar for the next two weeks is loaded. The Federal Reserve's FOMC decision lands October 28. A large BTC options expiry hits October 30, with a bullish skew in the open interest. And the US midterm elections follow on November 3. Any one of these could be the match that lights the fuse.
The Options Market's Hint
There's a subtle tell in the options skew. November's 25-delta risk reversal stood at -3.19 volatility points on October 19. Under the call-minus-put convention, a negative reading means puts carried higher implied volatility than comparable calls. The downside protection premium is elevated relative to upside bets. That doesn't predict direction, but it tells you the options market is slightly more nervous about a move down than up.
Where cohort data helps: Breakout positioning improves dramatically when you can see what the largest wallets are doing ahead of the catalyst. If Leviathans (wallets with $5M+ in perp equity) are quietly accumulating before FOMC, that's a directional signal the aggregate open interest won't show you. If they're flat, the breakout may lack conviction.
Cohort Data as the Low-Volatility Edge
All three strategies share a dependency: they need context about who is positioned where. Aggregate metrics like open interest and funding rate tell you the crowd's stance, but they don't tell you which part of the crowd. A funding rate of 0.0035% that's driven by retail Fish (wallets with $250 to $10K) going long tells a different story than the same rate driven by Tidal Whales ($1M to $5M).
HyperTracker classifies every wallet on Hyperliquid into 16 behavioral cohorts, split by wallet size (8 tiers from Shrimp to Leviathan) and by all-time PnL performance (8 tiers from Money Printer to Giga-Rekt). That classification is the difference between reading the market as one number and reading it as 16 distinct signals.
During low-volatility periods, the signals that matter most are:
- Smart Money positioning bias: Are the profitable cohorts (Money Printers, Smart Money, Consistent Grinders) adding or reducing? Their aggregate direction often leads the next move.
- Whale concentration: Are the largest wallets accumulating in one direction? High concentration among Whales, Tidal Whales, and Leviathans signals conviction. Low concentration means even the big players are waiting.
- Retail vs. smart money divergence: When Fish and Shrimp lean hard one way while Smart Money leans the other, the breakout direction often favors the smart money side.
Track Cohort Positioning Through the Calm
HyperTracker's API delivers cohort-level positioning data for all 16 segments on Hyperliquid. See what Smart Money, Whales, and Leviathans are doing before the aggregate numbers catch up. Start with the free tier at 100 requests per day.
Reading the Setup: A Practical Framework
Putting the three strategies together into a decision framework means watching three variables simultaneously: volatility regime, cohort positioning, and catalyst proximity.
| Signal | Favors Funding Arb | Favors Mean Reversion | Favors Breakout | | --- | --- | --- | --- | | Funding steady positive | Yes | Neutral | Neutral | | Whales net long, steady | Yes (supports funding) | Yes (range floor holding) | Weak (no urgency) | | Smart Money adding near edge | Neutral | Yes (confirmation) | Neutral | | Catalyst within 7 days | Reduce (vol risk) | Tighten stops | Yes (prime time) | | Leviathans accumulating quietly | Neutral | Careful (range may break) | Yes (directional signal) | | Retail-smart money divergence | Neutral | Yes (fade retail side) | Yes (favor smart money side) |
The framework isn't a mechanical system. It's a lens for interpreting what the market is doing beneath the surface. In a volatility compression, the surface tells you nothing. The positioning underneath tells you everything.
What Happens When the Calm Breaks
The transition from compressed to expanding volatility is where most traders get caught. They've been mean-reverting successfully for weeks, the range breaks, and they're suddenly on the wrong side of a 5% move with stops that weren't wide enough.
The practical defense is simple: when DVOL starts climbing above 45 or when funding rates spike above 0.01% per eight hours for more than a few days, the low-volatility playbook is expiring. Shift from range strategies to trend strategies. Reduce position sizes until the new regime is clear. Watch cohort positioning for confirmation of direction.
The October 28 FOMC meeting, the October 30 options expiry, and the November 3 midterms are the three likeliest triggers for that transition. Traders who are positioned for the current calm while preparing for the expansion, rather than being surprised by it, will be the ones who navigate the shift cleanly.
Volatility doesn't disappear. It migrates from the chart to the positioning data, waits there patiently, and then releases all at once. The traders who can read the positioning while the chart is flat are the ones who catch the move when it finally comes.