
Bitcoin ETF Outflows Hit $636M: How Perp Traders Saw It Coming
By CMM Team - 23-Oct-2026
Bitcoin ETF Outflows Hit $636M: How Perp Traders Saw It Coming
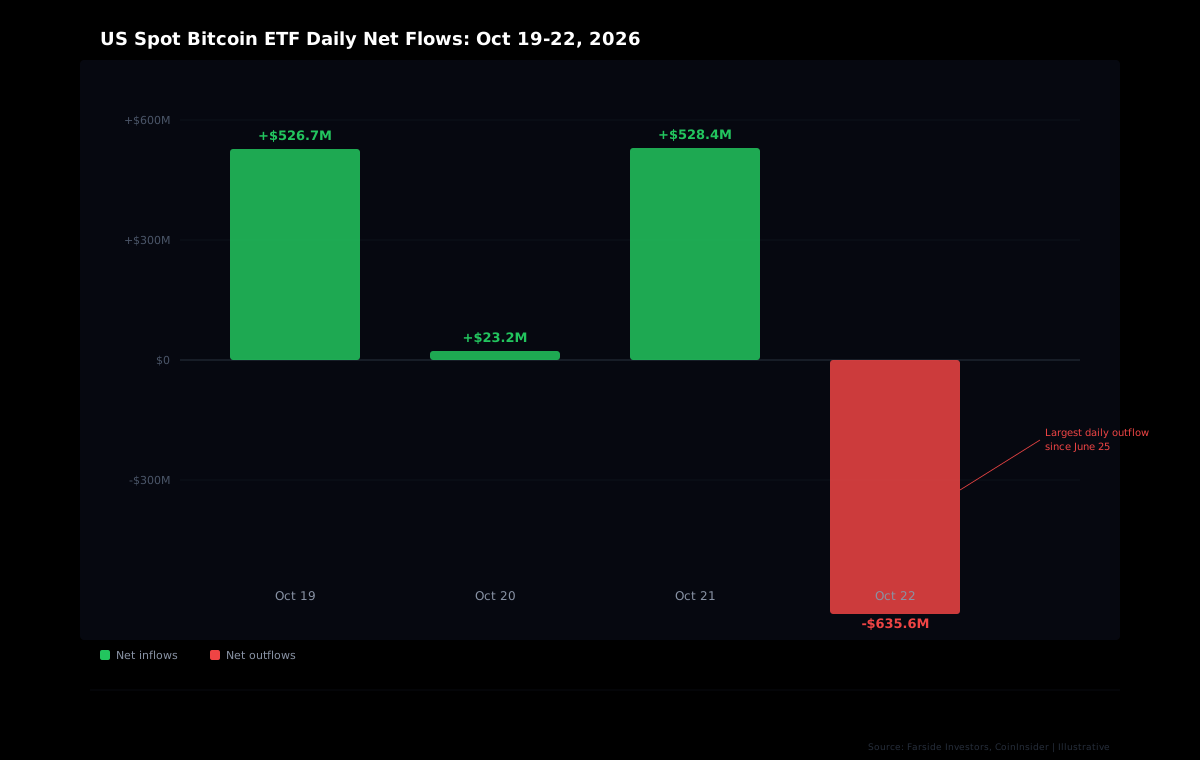
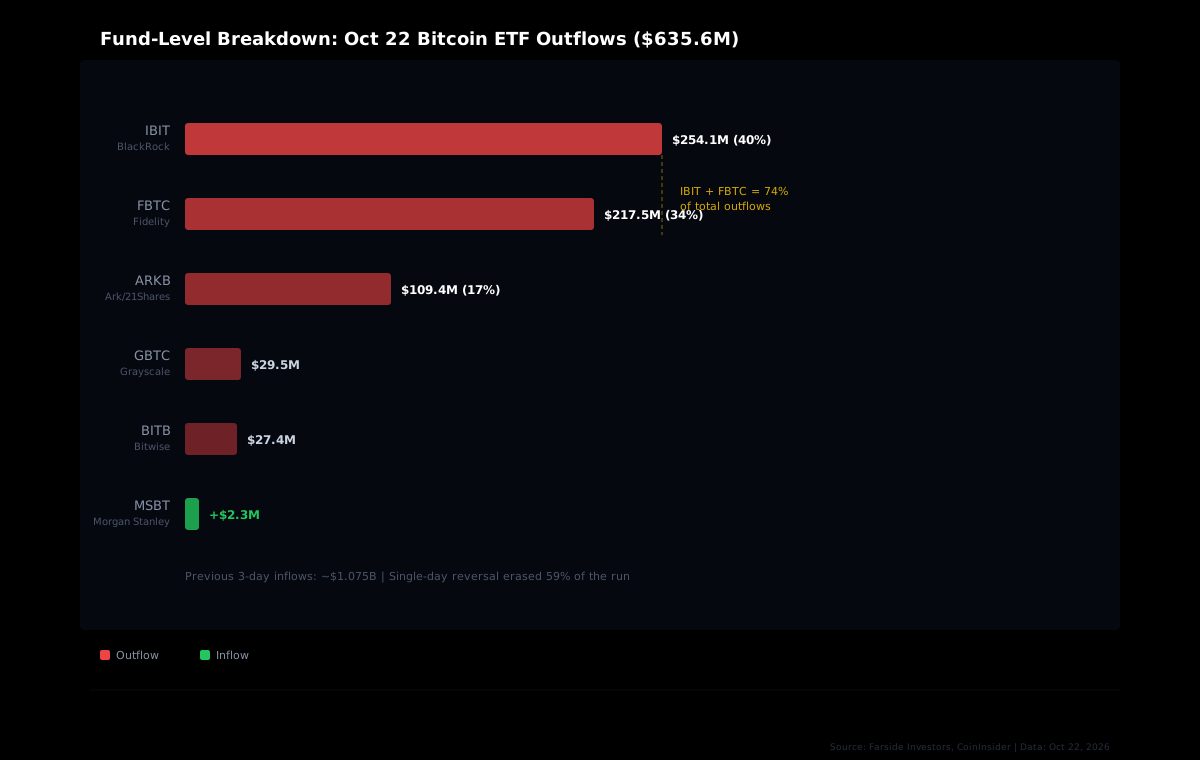
US spot Bitcoin ETFs bled $635.6 million on October 22, the largest single-day outflow since June. Three straight days of inflows totaling roughly $1.075 billion vanished in a single session. BlackRock's IBIT led the redemptions at $254.1 million, Fidelity's FBTC followed with $217.5 million, and the rest of the complex piled on.
But here's what mattered more than the headline number: the perp market had already started moving. Bitcoin futures open interest had been quietly declining in the days before, slipping from $36.5 billion to $36.4 billion in the week ended October 18. The 7-day moving average of BTC open interest had crossed below the 365-day average, a signal that traders were already de-risking before the ETF data dropped. When the $635.6 million flush hit, it triggered a cascade of long liquidations, over $418 million in 24 hours, with longs making up 91% of the damage.
The ETF outflow itself wasn't the trade. The trade was reading positioning before the outflow published. That's the difference between getting caught in the flush and being positioned for it.
Three Days of Inflows, One Day to Erase Them
The setup was deceptively bullish. Bitcoin ETFs posted $526.7 million in net inflows on Monday October 19, added a modest $23.2 million Tuesday, then stacked another $528.4 million on Wednesday. Over three sessions, more than a billion dollars poured into spot Bitcoin products, and traders watching the ETF flow data saw institutional accumulation at its most aggressive pace in weeks.
Then Thursday happened. The Nasdaq dropped 2.6% after Tesla cut its AI spending forecast, dragging the S&P 500 down 1.21% and hammering the Philadelphia Semiconductor Index by 6.7%. Risk assets across the board got sold. Bitcoin, which had touched $84,835 the day before, dropped to an intraday low of $80,958.
The ETF outflows followed the equity selloff, erasing roughly 59% of the three-day inflow streak in a single session. That's not a slow bleed. That's institutional capital exiting as fast as it entered.
Who Sold and How Much
Two funds accounted for nearly three-quarters of the outflows. BlackRock's IBIT, the largest spot Bitcoin ETF by assets, shed $254.1 million in a single day. Fidelity's FBTC wasn't far behind at $217.5 million. Together, they represented 74% of the total redemption.
Ark Invest and 21Shares' ARKB added $109.4 million in outflows. Grayscale's GBTC, once the dominant outflow source during its early conversion days, posted a relatively muted $29.5 million. Bitwise's BITB lost $27.4 million.
Morgan Stanley's MSBT was the lone bright spot, adding $2.3 million. That one fund swimming against the current says more about the nature of the selling than the headlines do. When the largest allocators (BlackRock, Fidelity) are redemming while a smaller player is still buying, it suggests the outflow is driven by macro portfolio rebalancing rather than a directional Bitcoin thesis change.
The Liquidation Cascade
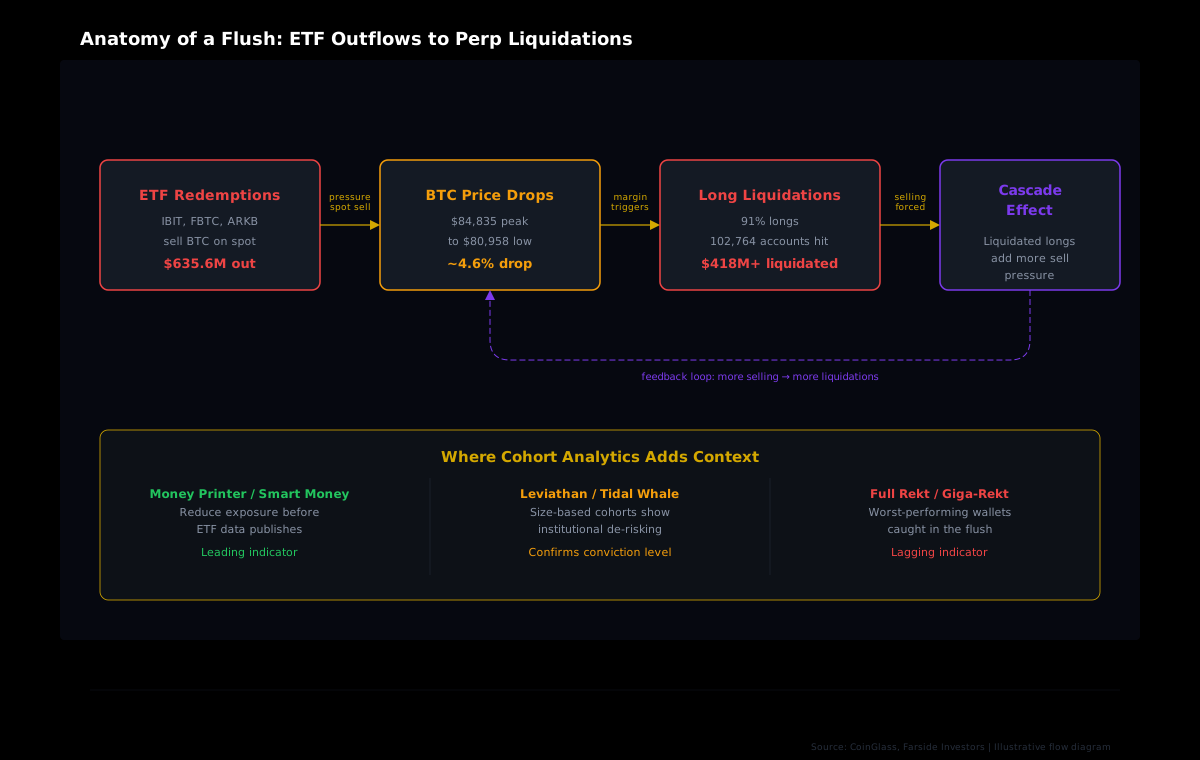
ETF redemptions don't happen in a vacuum. When a fund like IBIT processes net outflows, it sells the underlying BTC on spot markets to meet those redemptions. That selling pressure pushes price lower. And when price drops, leveraged perp traders on the wrong side of the trade start getting liquidated.
On October 22, more than $418 million in long positions were wiped out across crypto. Long positions made up 91% of the total. Over 54,000 orders were liquidated.
The mechanics are straightforward but brutal. ETF outflows create spot selling pressure. Spot selling drops the price. Price dropping triggers margin calls on leveraged longs. Forced liquidations add even more sell pressure, which triggers more liquidations. It's a feedback loop, and it's why a $635 million ETF outflow can create damage far exceeding its face value.
The largest single liquidation was an $11.8 million BTC long on Binance. One trader, one position, margin-called in the cascade.
Why Open Interest Told the Story First
The headline ETF outflow data publishes after the fact. By the time you see "$635.6M out" in your morning feed, the damage is already priced in. But open interest tells a different story, and it starts telling it earlier.
In the week before the October 22 flush, Bitcoin futures OI slipped 0.3% to $36.4 billion from $36.5 billion. That's a small number, but what matters is the context. Price was pushing higher (Bitcoin touched $84,835 on October 21), but open interest wasn't following. Derivatives analysts at multiple desks noted that "the dollar value of open interest fell roughly in line with price, which implies the number of open contracts barely changed."
That divergence, price up while OI is flat or declining, is one of the most reliable warning signals in perp markets. It means new money isn't entering the trade. Existing positions are just riding the wave, and without fresh capital to absorb selling pressure, any catalyst (like a Nasdaq selloff) can trigger a disproportionate drop.
The 7-day OI moving average crossing below the 365-day average added another layer. This cross had only happened once before since August, and it preceded a significant pullback that time too. Smart money watching OI data had a window to reduce risk. Everyone else read about it the next morning.
Reading the Flush Through Cohort Data
This is where generalized OI data hits its limits. Knowing that total open interest is declining is useful, but it doesn't tell you who is selling. A $10 million position close by a Leviathan account ($5M+ in equity) carries a completely different signal than 10,000 retail accounts each closing $1,000 positions. The total OI change is identical. The meaning is opposite.
HyperTracker's cohort analytics solve this by classifying every wallet on Hyperliquid into one of 16 behavioral segments: eight by wallet size (from Shrimp at $0-$250 to Leviathan at $5M+) and eight by all-time PnL (from Money Printer at +$1M to Giga-Rekt at below -$1M). When you can see that Money Printer wallets, the accounts with the strongest historical track records, are reducing BTC exposure before a macro event, that's a qualitatively different signal than watching aggregate OI tick down by 0.3%.
Consider what this looks like in practice during an event like October 22:
- Money Printer and Smart Money cohorts (wallets with +$100K to $1M+ in all-time PnL) tend to adjust positioning ahead of macro catalysts. They watch equity futures, monitor ETF flow patterns, and reduce exposure before the data prints.
- Leviathan and Tidal Whale cohorts (wallets with $1M-$5M+ in equity) show the institutional-scale de-risking that often precedes major liquidation events. When these size cohorts pull back, it confirms that the smart money isn't just cautious, it's actively protecting capital.
- Full Rekt and Giga-Rekt cohorts (wallets with the worst all-time PnL) tend to be the last to adjust, often getting caught in exactly the kind of liquidation cascade that October 22 produced.
The pattern isn't unique to this event. It repeats across virtually every major ETF flow reversal, every macro-driven liquidation cascade, and every funding rate squeeze. The wallets with the best track records move first. The wallets with the worst track records absorb the damage.
Our data tracks all 16 cohorts across Hyperliquid in near-real-time. When Money Printer wallets start reducing BTC exposure and Leviathan accounts pull back on size, that combination has historically preceded the kind of flush that hit on October 22. The signal lives in the cohort breakdown.
What This Means Going Forward
The October 22 outflow was significant but not catastrophic. Despite losing $635.6 million in a day, Bitcoin ETFs remained positive for the week at roughly $439 million in net inflows. Since their January 2024 launch, US spot Bitcoin ETFs have accumulated tens of billions in total net inflows. One bad day doesn't reverse two years of institutional accumulation.
But the pattern matters. Bitcoin has been trading in an $80,000 to $86,000 range, and analyst Jeff Anderson of STS Digital noted that "market attention is focused on the direction of any breakout." The combination of range-bound price action, macro headwinds from AI spending concerns, and rising oil prices creates a fragile setup. Any future catalyst, positive or negative, could break the range decisively.
For perp traders, the playbook is clear. Watch the cohort data for early positioning shifts by high-conviction wallets. Monitor OI divergences (price up, OI flat = vulnerability). And treat ETF flow data as backward-looking confirmation. By the time the outflow headline publishes, the smart money has already moved.
Track Smart Money Positioning Before the Headlines
HyperTracker's API gives you cohort-level analytics across Hyperliquid's 16 behavioral segments. See how Money Printer wallets, Leviathans, and every other cohort are positioning in near-real-time. One API call, 16 cohorts, $179/mo.
The Bigger Picture: ETF Flows as a Perp Trading Signal
Two years into the spot Bitcoin ETF era, a clear dynamic has emerged. ETF flows and perp markets are increasingly interconnected. Large ETF inflows create spot buying pressure that pushes price higher, which attracts leveraged longs on perp exchanges. When ETF flows reverse, those same leveraged longs become fuel for liquidation cascades.
The traders who consistently navigate these events share a common trait: they watch positioning data first. Price tells you what happened. Positioning tells you what's about to happen. And on Hyperliquid, where every trade is on-chain and every wallet can be classified by behavior, the positioning data is richer than anywhere else in crypto.
October 22 wasn't the first ETF flow reversal, and it won't be the last. The question for perp traders isn't whether another flush is coming. It's whether you'll see it in the cohort data before it shows up in the headlines.