1,411 Builders, $90M in Fees: Hyperliquid's Real Leaderboard
By CMM Team - 22-Jul-2026
1,411 Builders, $90M in Fees: Hyperliquid's Real Leaderboard
Most people look at a DEX and see a trading venue. Hyperliquid's builder code program tells a different story: 1,411 teams have collectively earned $90.7 million in fees by routing $274.9 billion in trading volume through third-party frontends. Figures as of July 2026, from HyperTracker's builder leaderboard.
That $90.7 million didn't go to Hyperliquid. It went to wallet providers, trading terminals, copy-trade bots, and analytics platforms that built on top of the protocol. And the distribution of that revenue is wildly uneven, which makes the leaderboard worth studying carefully.
We pulled the full builder leaderboard from our API and broke down the numbers: who earns the most, how their fee strategies differ, and what the concentration pattern means for anyone building on Hyperliquid today.
How Builder Codes Actually Work
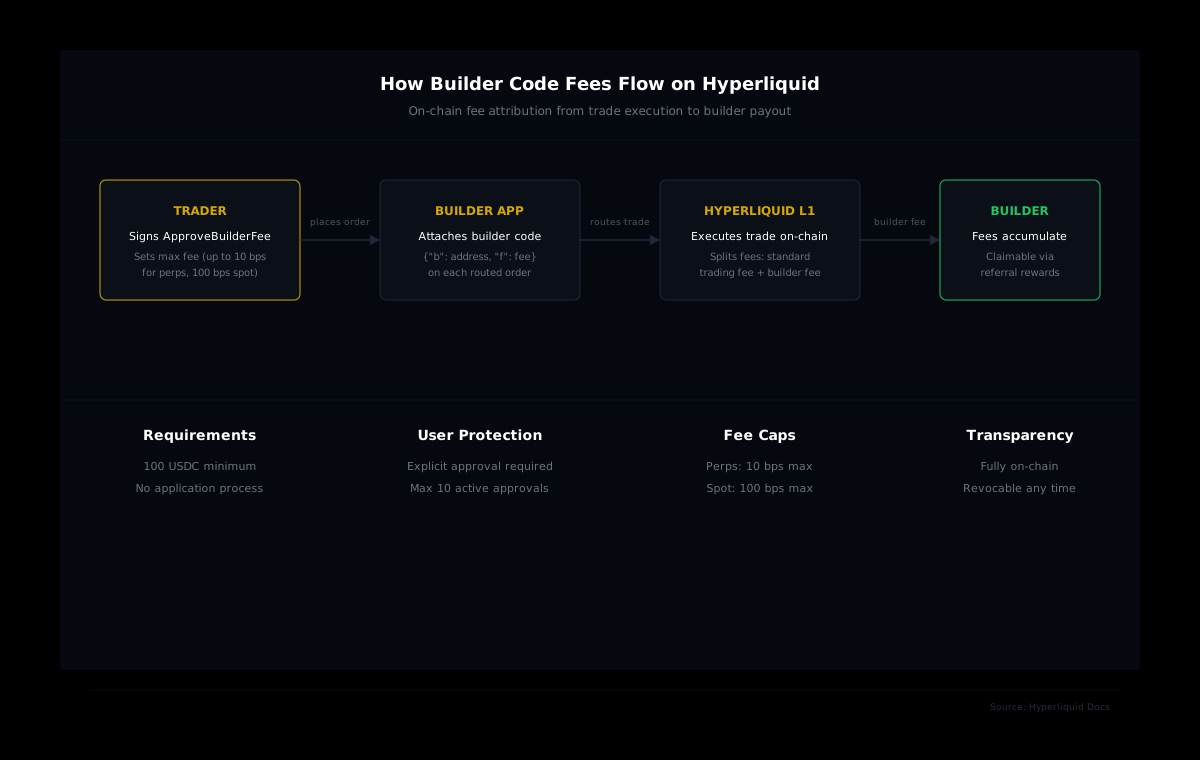
A builder code is Hyperliquid's on-chain mechanism for trade attribution. When a third-party app routes a trade through Hyperliquid, it can attach a builder address and a fee parameter to the order. The fee goes directly to the builder's account, separate from Hyperliquid's own trading fees.
The mechanics are straightforward. Builders need 100 USDC in their Hyperliquid perps account to register. Users must explicitly approve a maximum fee for each builder by signing an ApproveBuilderFee action with their main wallet. The cap is 10 basis points (0.1%) on perps and 100 basis points (1%) on spot. Builder fees are added on top of Hyperliquid's standard trading fees and processed entirely on-chain.
That user-approval requirement matters. Every builder fee is consensual, transparent, and revocable. Users can maintain up to 10 active builder code approvals at a time. There's no hidden rent extraction, which is why the builders who earn the most do so by genuinely routing massive volume through products people want to use.
The Top 15: Who Actually Earns
The leaderboard is top-heavy. Our data shows the top five builders account for roughly $58.6 million of the $90.7 million total, which means five teams captured about 65% of all builder revenue ever generated on Hyperliquid.
| Rank | Builder | Revenue | Users | Volume | Joined | | --- | --- | --- | --- | --- | --- | | 1 | Phantom | $23.6M | 153,128 | $44.8B | Jun 2025 | | 2 | Based | $15.2M | 42,967 | $44.9B | Jun 2025 | | 3 | MetaMask | $8.1M | 52,534 | $9.0B | Aug 2025 | | 4 | PVP | $8.0M | 28,223 | $17.1B | Jul 2024 | | 5 | Insilico | $3.7M | 3,339 | $36.3B | Jul 2024 | | 6 | Infinex | $2.8M | 9,283 | $5.2B | Aug 2025 | | 7 | Axiom | $2.4M | 34,093 | $23.0B | Jan 2025 | | 8 | TreadFi | $2.2M | 4,835 | $11.1B | Apr 2025 | | 9 | Dreamcash | $1.8M | 11,215 | $7.6B | Jun 2025 | | 10 | Liquid | $1.5M | 9,499 | $3.2B | Jun 2025 | | 11 | Rabby | $1.5M | 19,031 | $6.5B | Aug 2025 | | 12 | Mass | $1.5M | 1,054 | $2.5B | Jun 2025 | | 13 | Okto | $790K | 8,702 | $3.7B | Apr 2024 | | 14 | Defiapp | $780K | 8,183 | $5.5B | Mar 2025 | | 15 | Minara AI | $775K | 4,933 | $2.6B | Dec 2025 |
Look at the spread. Phantom alone has earned more than builders ranked 6 through 15 combined. That's a power-law distribution, exactly what you'd expect in a market where distribution is everything. The platform with the most existing users wins the most volume because users rarely switch wallets to trade.
The Fee Rate Gap: Why Earnings Per Dollar Vary 9x
Revenue alone doesn't tell the whole story. Divide each builder's revenue by its volume, and a very different picture emerges: builders are running fundamentally different fee strategies.
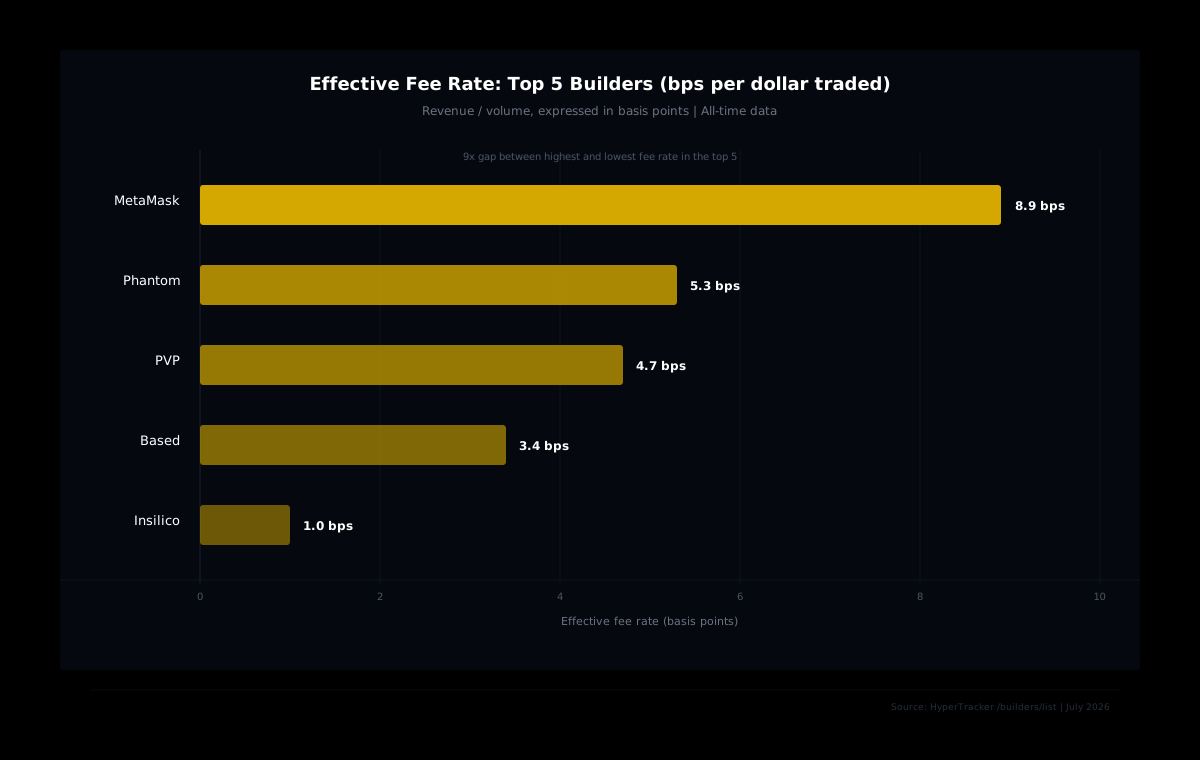
MetaMask charges the highest effective rate among the top five, at roughly 8.9 basis points per dollar traded. That's close to the 10 bps maximum for perps. Phantom sits at about 5.3 basis points. Based runs at 3.4 basis points, PVP at 4.7, and Insilico brings up the rear at just 1 basis point.
That 9x gap between MetaMask and Insilico isn't random. It reflects completely different business models:
- MetaMask charges a premium because its users are general-purpose wallet users who typically accept the fee rates offered. The wallet's massive existing install base gives it pricing power, and $9 billion in volume at 8.9 bps still dwarfs what most builders earn at lower rates.
- Insilico runs at 1 bps because its users are likely algorithmic traders and market makers who generate enormous volume per account. With just 3,339 users producing $36.3 billion in volume, each Insilico user trades an average of $10.9 million. That volume sensitivity demands a rock-bottom fee rate.
Phantom and PVP sit in the middle ground: consumer-facing products with engaged user bases that tolerate moderate fees in exchange for polished UX.
Revenue Per User: The Real Efficiency Metric
User counts are vanity metrics unless you know what each user is worth. Dividing revenue by user count reveals which builders have built the stickiest, highest-value user relationships.
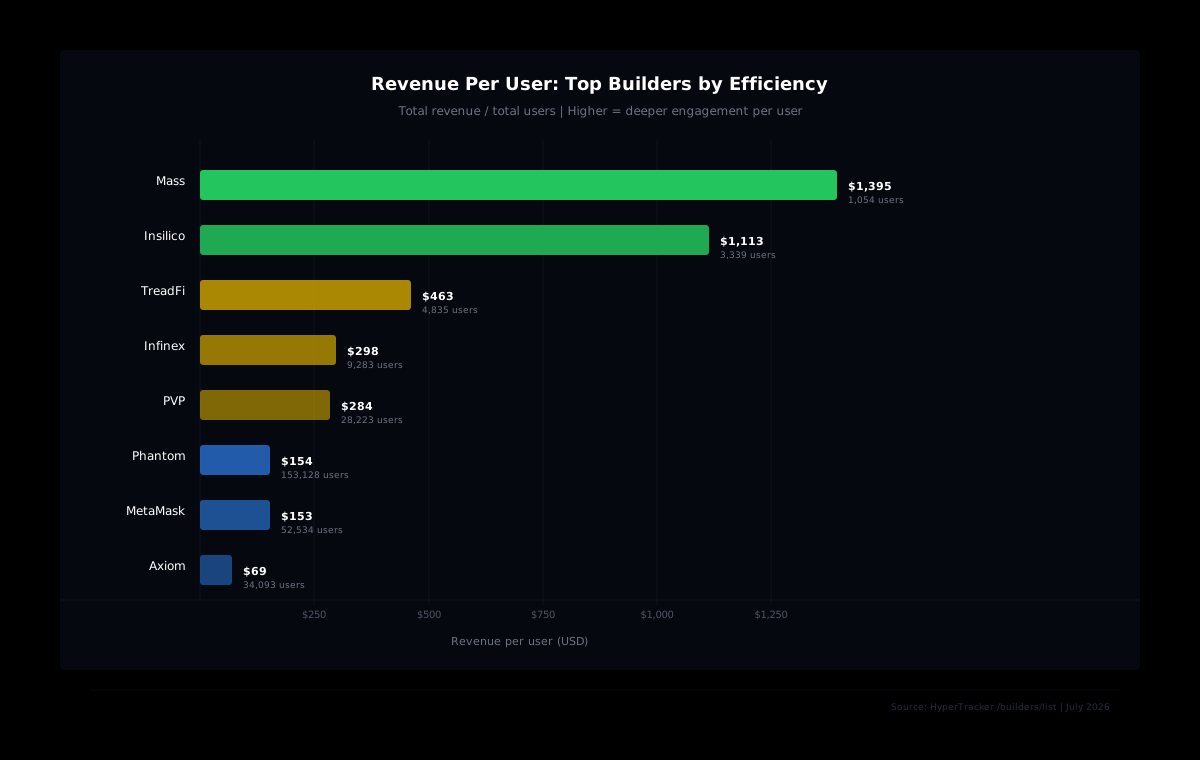
Mass leads the top 15 at roughly $1,395 in revenue per user, followed by Insilico at $1,113. Both serve small user bases of sophisticated traders. Compare that with Phantom at $154 per user and MetaMask at $153, where the denominator is six figures of users, most of whom trade smaller size and less frequently.
Axiom is particularly interesting: 34,093 users but only $2.4 million in revenue, putting it at around $69 per user. That's a broad distribution play, capturing a large audience at a low fee rate (about 1 basis point). Whether that audience converts into long-term revenue depends on how sticky the product is as users mature.
The takeaway for builders: a thousand power users can be worth more than a hundred thousand casual ones. The builder code model rewards depth of engagement, because fees scale with volume, and volume concentrates in the hands of active traders.
The Long Tail Problem
Behind the top 15 sit 1,396 other builder codes. Together they share roughly $15.5 million in revenue, which sounds meaningful until you do the math: that's an average of about $11,000 per builder across the entire tail.
Many of those builders earn close to nothing. Getting a builder code is trivially easy (100 USDC), which means the registry is full of experimental projects, abandoned bots, and personal-use codes. The real ecosystem is much smaller than 1,411 active participants.
This isn't unique to Hyperliquid. App stores, affiliate programs, and marketplace ecosystems all follow the same pattern: a small number of distributors capture the overwhelming majority of value. The difference is that Hyperliquid's builder code data is fully on-chain and queryable, so anyone can audit the concentration in real time.
What the Leaderboard Tells You About DEX Distribution
Hyperliquid's builder code program has effectively outsourced customer acquisition to third-party developers. Instead of spending on marketing, the protocol lets builders earn fees proportional to the volume they bring. This creates a few structural dynamics worth understanding.
Wallets dominate distribution
Phantom (rank 1), MetaMask (rank 3), and Rabby (rank 11) are all wallet providers. Between them, they've routed over $60 billion in volume and earned more than $33 million. Wallets win because they're the entry point: a user opens their wallet, sees Hyperliquid as a supported venue, and trades without ever visiting Hyperliquid's native frontend. The trade is attributed to the wallet's builder code automatically.
For builders considering where to integrate, the lesson is clear: being embedded in a user's daily workflow matters more than having a feature-rich standalone product.
Bots and terminals compete on volume
Insilico and TreadFi have a combined 8,174 users but have routed $47.4 billion in volume. That's an average of $5.8 million per user. Trading bots and algorithmic platforms attract smaller user bases, though those users trade at industrial scale. The builder code model suits them perfectly because fees scale linearly with volume.
The 100 USDC barrier is too low to be a filter
With 1,411 registered builders and realistically fewer than 100 earning meaningful revenue, the builder code registry functions more like an open directory than a curated marketplace. Hyperliquid may eventually need to differentiate between active and inactive builders for discovery purposes, though the on-chain transparency means anyone can filter by actual performance.
Tracking Builder Performance Programmatically
Every number in this article came from a single API call to our builder analytics endpoint. HyperTracker's /builders/list endpoint returns the full leaderboard with revenue, user counts, volume, and join dates for every registered builder code on Hyperliquid.
If you're building on Hyperliquid, this data lets you benchmark your builder code performance against the ecosystem. If you're a trader, it tells you which frontends are routing the most volume and at what fee rate, so you can make informed choices about which builder fees you approve.
Our API also tracks builder performance across different timeframes (daily, weekly, monthly, all-time), so you can spot which builders are gaining or losing momentum.
Query the Full Builder Leaderboard
HyperTracker's API gives you programmatic access to builder code rankings, revenue breakdowns, and volume attribution across every registered builder on Hyperliquid.
The Builder Economy Is Still Early
$90.7 million in total builder fees sounds like a mature ecosystem, but the growth trajectory suggests this is still the early phase. The total has grown rapidly over the past year as more builders integrated and Hyperliquid's trading volume expanded. The introduction of HIP-3 (traditional asset perps) and HIP-4 (prediction markets) adds entirely new volume categories that builders can route through their codes.
Two developments are worth watching. First, the staking referral program will let builders and referrers who stake HYPE keep a percentage of their referred users' trading fees, up to 40% at the highest tier. That could significantly change the revenue math for top builders. Second, as Hyperliquid's volume grows, the absolute dollar value of even a 1 basis point fee rate becomes substantial. A builder routing $1 billion in monthly volume at 1 bps earns $100,000 per month before doing anything else.
The leaderboard will look different a year from now. But the pattern it reveals today (wallets winning distribution, bots winning volume efficiency, fee strategy mattering as much as user count) will likely hold. Builders who understand these dynamics early have the clearest path to earning from the protocol's growth.