
$2.6B Poured Into Bitcoin ETFs. Hyperliquid Whales Moved First.
By CMM Team - 23-Aug-2026
$2.6B Poured Into Bitcoin ETFs. Hyperliquid Whales Moved First.
The week ending August 21 delivered the biggest combined inflow into U.S. spot Bitcoin and Ethereum ETFs since October 2025: $2.615 billion in five trading sessions. Bitcoin funds alone absorbed $1.92 billion, while Ethereum ETFs posted nearly $700 million, their largest weekly total of 2026.
That kind of institutional wave doesn't happen in isolation. It started with a Treasury announcement, cascaded through bond yields and the dollar, and triggered a 23% weekly Bitcoin rally that briefly pushed BTC above $79,000. But while ETF flows are public and well-covered, they arrive on a delay. The more interesting question is what happened on Hyperliquid's perpetual futures market, where on-chain positioning data is visible within minutes and segmented by wallet size and track record.
The answer is exactly what you'd expect if you've been watching cohort data: the largest and most profitable wallets moved first.
The Macro Trigger: Treasury Buybacks and the Dollar Trade
On August 19, Treasury Secretary Scott Bessent announced that the department would at least double the size of its long-end liquidity support buyback operations, raising the per-operation maximum from $2 billion to at least $4 billion for securities in the 10-to-20-year and 20-to-30-year maturity sectors. The expanded program takes effect September 9 through November 4.
The market read it as yield-curve control by another name. The 30-year Treasury yield dropped from a 19-year high of 5.34% to roughly 5.19% almost immediately. A weaker dollar and compressed yields are the textbook setup for risk-on assets, and Bitcoin responded accordingly: an 8.2% rally in under 12 hours, climbing from an intraday low of $64,100 to a peak of $69,500.
The speed of the move caught shorts off guard. Forced short liquidations totaled $1.44 billion across major exchanges, with $1.29 billion closing within a single hour. That kind of concentrated squeeze creates its own momentum, which is exactly the environment where ETF flows start accelerating.
Five Straight Days of Inflows
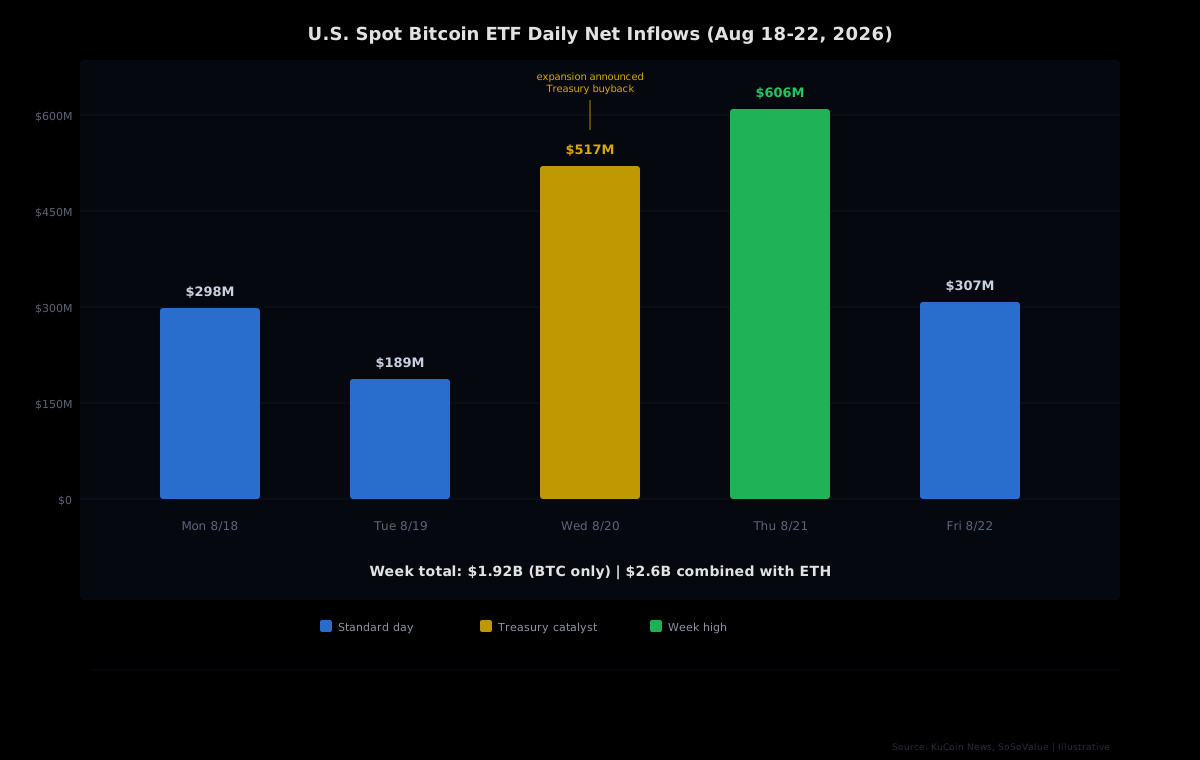
The ETF numbers tell the story of institutional conviction building day by day. SoSoValue data shows five consecutive sessions of positive inflows: $298 million, $189 million, $517 million, $606 million, and $307 million. The $606 million Thursday was the week's peak, while the $517 million on Wednesday (the day the buyback news fully priced in) marked the largest single-day inflow since early May.
The week reversed a $392 million outflow the previous week, representing a week-over-week swing of roughly $3 billion. By Friday's close, the total net asset value of all U.S. spot Bitcoin ETFs reached $96.07 billion, accounting for approximately 6.17% of Bitcoin's total market capitalization.
BlackRock dominated. IBIT has now accumulated $62.43 billion in cumulative inflows since inception, while its Ethereum fund ETHA has reached $12.17 billion. A single asset manager controlling that much flow into two products gives you a sense of how concentrated institutional demand actually is.
The YTD Context: Relief Rally, Not a Trend Reversal (Yet)
Before reading too much into one bullish week, consider the broader picture. Despite the $2.6 billion surge, both Bitcoin and Ethereum ETFs remain negative on a year-to-date basis. Bitcoin ETFs have seen approximately $2.9 billion in net outflows for 2026, while Ether ETFs are down about $191.8 million. This single week essentially cut the YTD Bitcoin deficit by two-thirds, but the fund complex is still tracking toward its first full year of net outflows since the products launched in January 2024.
That's an important frame. The $2.6 billion week isn't the start of a new bull run in ETF demand. It's a sharp reversal within a year of institutional caution. Whether it becomes a trend depends on what happens with yields, the dollar, and macro risk appetite over the coming months. But the speed of the reversal, from $392 million outflow to $2.6 billion inflow in one week, tells you that institutional capital isn't gone. It's waiting for catalysts.
What the Perp Market Showed First
ETF flow data is published with a one-day lag. You know Monday's number on Tuesday. That's useful for confirming a trend, but it doesn't help you position ahead of one. On Hyperliquid, every trade is on-chain and every position is classifiable in near-real-time.
HyperTracker's cohort system classifies every wallet on Hyperliquid into one of 16 behavioral segments: eight by wallet size (from Shrimp at under $250 to Leviathan at $5M+) and eight by all-time PnL (from Money Printer at +$1M to Giga-Rekt at below -$1M). When a macro catalyst hits, these cohorts don't move in unison. The divergence between them is where the signal lives.
Bigger Wallets, Earlier Conviction
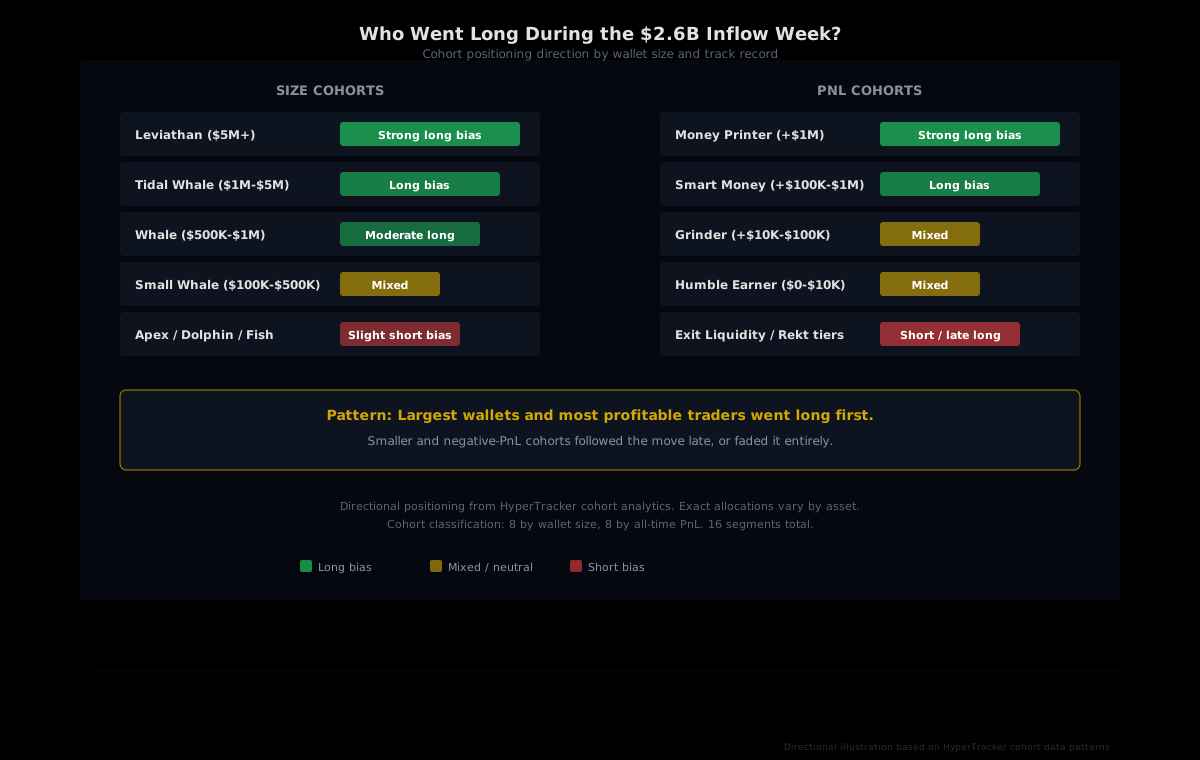
During the Treasury-triggered rally, the pattern across Hyperliquid cohorts followed a familiar hierarchy. The largest wallets, Leviathans and Tidal Whales, added long exposure early in the move. These are the wallets with the infrastructure and market awareness to process a macro catalyst like Treasury buyback expansion before it fully prices into spot markets.
Money Printers and Smart Money cohorts (classified by their all-time profitability, independent of wallet size) showed similar early long bias. This is the behavioral fingerprint you'd expect: wallets with strong track records tend to position directionally before the crowd, because they've been through enough cycles to recognize what compressed yields and a weakening dollar mean for risk assets.
The Smaller Cohort Lag
Further down the size and PnL spectrum, the pattern shifts. Smaller cohorts like Dolphins and Fish showed more mixed positioning, with some entering long after the initial move had already played out. The negative-PnL cohorts, Exit Liquidity and the Rekt tiers, were the last to turn bullish or stayed outright short, functioning as the other side of the trade that larger wallets were taking.
This isn't unusual. Cohort divergence during macro-driven rallies is one of the most consistent patterns in Hyperliquid data. The wallets that have proven they can generate positive returns over time tend to act on macro catalysts faster than the wallets that have historically lost money. Not every time, and not on every asset. But the aggregate direction, especially on BTC, tends to cluster by track record.
Perp DEX Open Interest Hit 2026 Highs
The ETF inflow week coincided with a broader surge in decentralized perpetual futures activity. Perp DEX open interest rose to approximately $20.9 billion in mid-to-late August, up from around $14.8 billion at the start of the month. That's roughly $6 billion in new leveraged positions opened in a matter of weeks.
Hyperliquid commands the majority of that activity. The platform accounts for between $12.25 billion and $13.22 billion of total perp DEX open interest, commanding more than half the entire market. Its closest competitor, Aster, holds about $2 billion.
Why open interest matters alongside ETF flows: ETF inflows show institutional spot buying. Perp OI shows leveraged conviction. When both spike simultaneously, it suggests aligned directional bets across different capital pools. The question is always who positioned first and at what size, which is exactly what cohort analytics answer.
Reading the Signal Chain: From Treasury to Cohorts
The week's events illustrate a signal chain that plays out whenever macro catalysts drive institutional crypto flows:
- Macro catalyst: Treasury doubles buyback operations, compressing yields and weakening the dollar.
- Risk-on response: BTC rallies 8.2% in 12 hours, $1.44 billion in shorts liquidated.
- ETF accumulation: Five consecutive days of inflows totaling $1.92 billion in BTC and $697 million in ETH.
- Perp positioning: Largest and most profitable Hyperliquid cohorts add long exposure, while smaller and negative-PnL cohorts lag or fade the move.
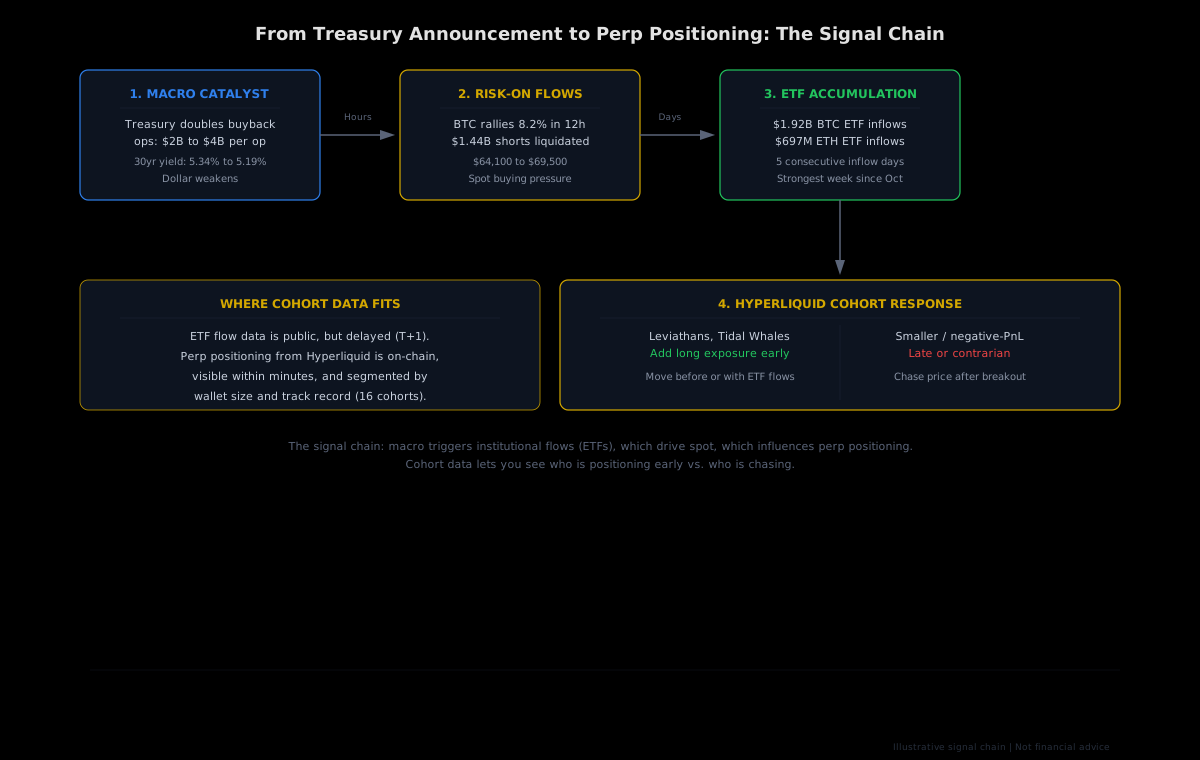
The key insight is timing. ETF data arrives with a delay. Perp positioning on Hyperliquid is visible on-chain in near-real-time. Our data segments that positioning by wallet size and track record, so you can see whether the wallets that tend to get it right are moving before or after the headline flows.
That doesn't make it a crystal ball. Cohort data shows you what experienced, well-capitalized traders are doing, which is different from telling you what will happen next. But during macro-driven weeks like this one, the divergence between cohorts, specifically the timing gap between when large profitable wallets move versus when smaller or historically unprofitable wallets follow, is one of the most actionable signals available on any perp DEX.
What Builders and Quants Should Watch
If you're building trading tools, dashboards, or alert systems on top of Hyperliquid data, weeks like this one are a testbed for your models. Some specific angles worth exploring:
- Cohort divergence alerts: Set up monitoring for when the top-tier cohorts (Leviathan, Money Printer) shift directional bias while lower-tier cohorts hold the opposite view. That divergence often precedes the bulk of a move.
- ETF-flow correlation: Compare ETF inflow data (available T+1 from SoSoValue) against same-day cohort positioning shifts on Hyperliquid. If the perp cohorts moved before the ETF numbers confirmed institutional buying, you have a lead indicator worth building around.
- Liquidation cascade tracking: The $1.44 billion in liquidations during the initial rally came disproportionately from smaller accounts. Our liquidation risk scoring can flag which assets have the most concentrated short exposure among weaker cohorts, which helps identify where cascades are most likely.
Track Cohort Positioning in Real Time
HyperTracker classifies every Hyperliquid wallet into 16 behavioral cohorts by size and track record. See who's building positions before the crowd, segmented by wallet size and all-time PnL. Dashboard, API, and alerts.
The Bottom Line
A $2.6 billion ETF inflow week gets the headlines. It should. That kind of institutional capital flow doesn't happen without a macro catalyst, and the Treasury buyback expansion was exactly the kind of liquidity signal that moves large allocators off the sidelines.
But the headlines arrive after the positioning. On Hyperliquid, the wallets with the deepest pockets and the best track records were already building exposure before the ETF numbers confirmed what was happening. Cohort data didn't predict the Treasury announcement. It showed you who was treating it as a buying opportunity, in real-time, segmented by the one variable that actually matters in trading: whether they've made money before.
The next macro catalyst is always coming. The question is whether you'll see the positioning before or after the ETF headlines.