
$23M from One Builder Code: Hyperliquid's Full Leaderboard
By CMM Team - 13-Aug-2026
$23M from One Builder Code: Hyperliquid's Full Leaderboard
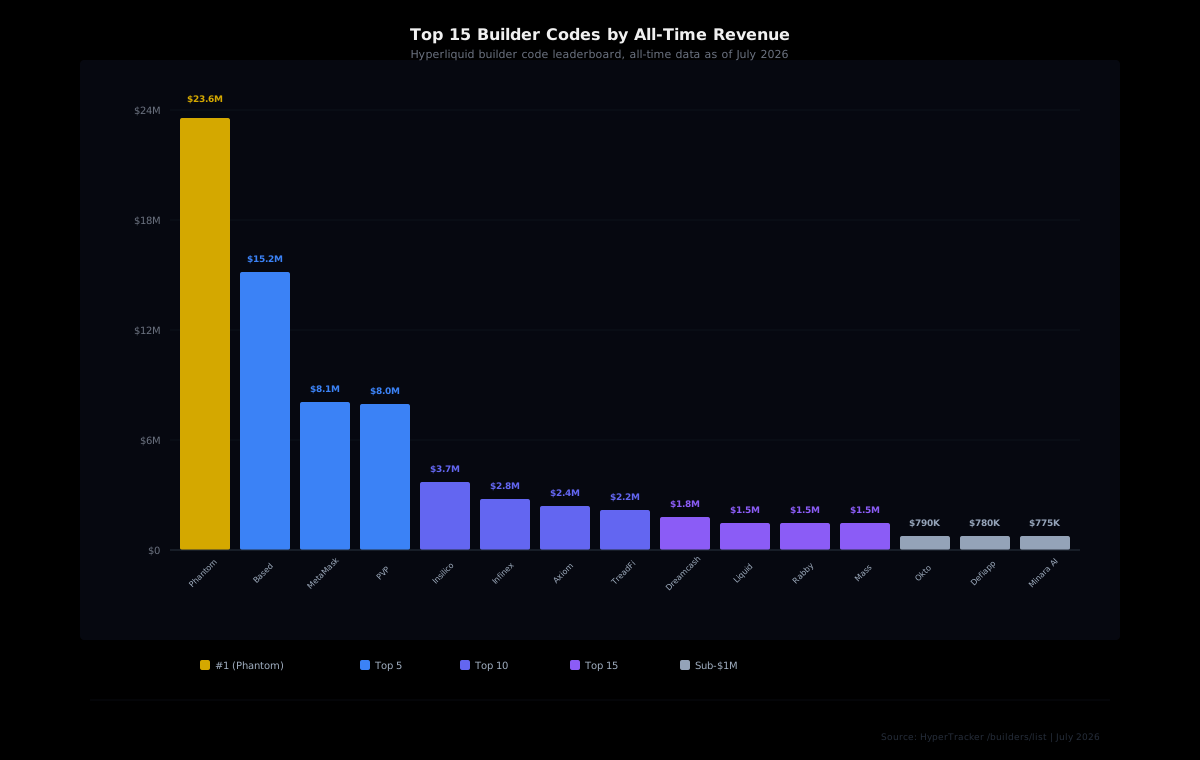
Phantom has pulled in over $23.6 million in builder code revenue on Hyperliquid. One integration. One referral code. That single number reveals something the broader market hasn't fully grasped yet: builder codes aren't a sideshow on Hyperliquid. They're a real revenue channel, and the leaderboard tells you exactly who's capturing value from the protocol's growth.
Figures as of July 2026, from HyperTracker's builder leaderboard.
Across 1,411 registered builder codes, the Hyperliquid ecosystem has generated over $90.7 million in all-time builder revenue on $274.9 billion in attributed volume. But that revenue concentrates heavily at the top. The top five codes alone account for roughly $58.6 million of the total, which means the remaining 1,406 builders split about $32 million between them.
This article breaks down the full leaderboard, examines what separates the top builders from the rest, and shows how to track builder code performance programmatically through our API.
The Top 15: Who's Actually Earning
Builder codes on Hyperliquid work like referral codes with on-chain attribution. When a user trades through an app or frontend that embeds a builder code, a share of the trading fees flows to the builder. The more volume a code drives, the more revenue it generates. Simple mechanics, but the outcomes are wildly uneven.
Here's the all-time leaderboard as of July 2026:
| Rank | Builder | Revenue | Users | Volume | Joined | | --- | --- | --- | --- | --- | --- | | 1 | Phantom | $23.6M | 153,128 | $44.8B | Jun 2025 | | 2 | Based | $15.2M | 42,967 | $44.9B | Jun 2025 | | 3 | MetaMask | $8.1M | 52,534 | $9.0B | Aug 2025 | | 4 | PVP | $8.0M | 28,223 | $17.1B | Jul 2024 | | 5 | Insilico | $3.7M | 3,339 | $36.3B | Jul 2024 | | 6 | Infinex | $2.8M | 9,283 | $5.2B | Aug 2025 | | 7 | Axiom | $2.4M | 34,093 | $23.0B | Jan 2025 | | 8 | TreadFi | $2.2M | 4,835 | $11.1B | Apr 2025 | | 9 | Dreamcash | $1.8M | 11,215 | $7.6B | Jun 2025 | | 10 | Liquid | $1.5M | 9,499 | $3.2B | Jun 2025 | | 11 | Rabby | $1.5M | 19,031 | $6.5B | Aug 2025 | | 12 | Mass | $1.5M | 1,054 | $2.5B | Jun 2025 | | 13 | Okto | $790K | 8,702 | $3.7B | Apr 2024 | | 14 | Defiapp | $780K | 8,183 | $5.5B | Mar 2025 | | 15 | Minara AI | $775K | 4,933 | $2.6B | Dec 2025 |
Three Models That Win: Volume, Users, or Efficiency
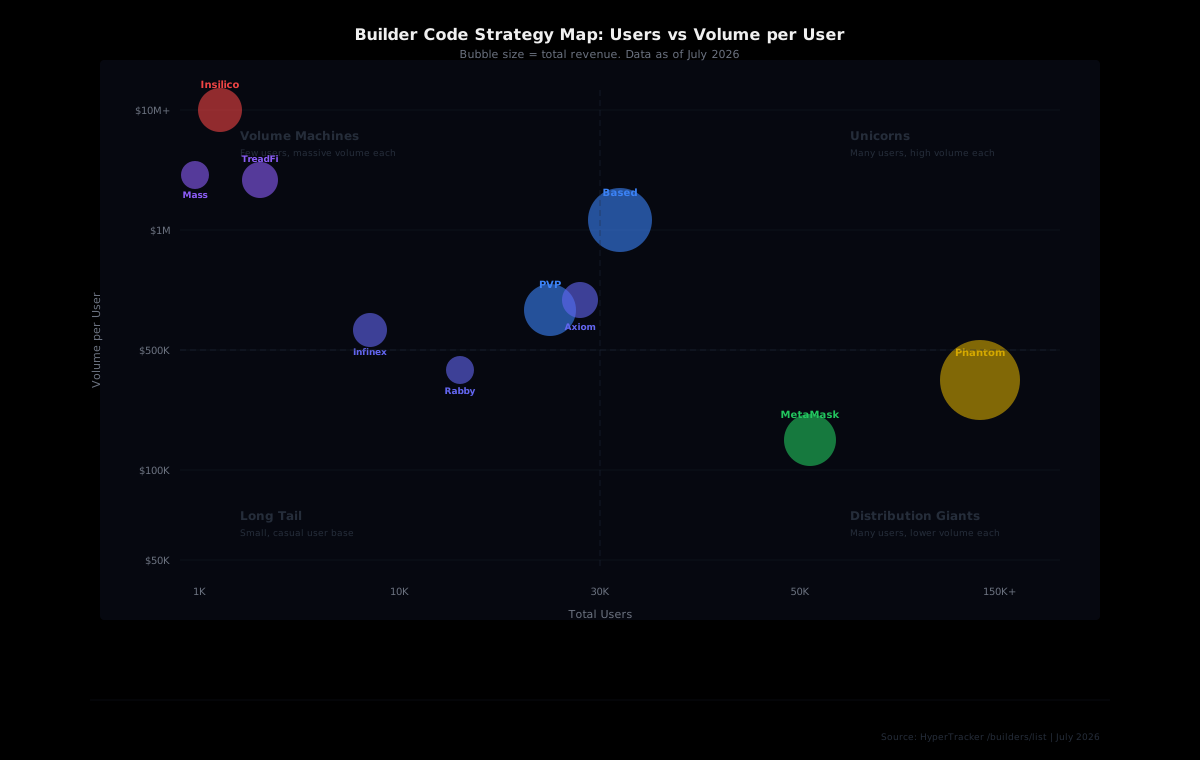
The leaderboard isn't one story. It's at least three different approaches to building on Hyperliquid, and each one generates revenue through a distinct mechanism.
The Distribution Giants
Phantom and MetaMask sit in this category. Phantom brings 153,128 users and earns the most revenue of any builder code on the platform. MetaMask follows with 52,534 users. Both are wallet providers whose core product already has millions of users. They don't need to build a trading interface from scratch. They embed Hyperliquid perps as a feature inside their existing wallet, and every trade their users make gets tagged to the builder code.
The distribution model thrives on breadth. Neither Phantom nor MetaMask has the highest volume-per-user ratio, but the sheer number of wallets funneling trades through their code generates massive cumulative revenue. This is the advantage of being an established wallet: you inherit your entire existing user base as potential Hyperliquid traders.
The Volume Machines
Based and Insilico represent the opposite approach. Based generated $44.9 billion in volume with only 42,967 users, which means each user traded roughly $1.05 million on average. Insilico is even more extreme: $36.3 billion in volume from just 3,339 users, putting its average volume per user above $10.8 million.
These are products that attract heavy traders. Quant desks, market makers, high-frequency strategies. The user counts are modest, but each user generates enormous volume because the product is built for serious execution. If you're building a trading tool aimed at professional or semi-professional traders, this model tells you that user count is far less important than volume per user when it comes to builder code revenue.
The Revenue-Efficient Operators
Then there's a third pattern that shows up when you look at revenue relative to volume. Mass has only 1,054 users and $2.5 billion in volume, but it pulled $1.5 million in revenue. That's roughly $0.59 earned per $1,000 of volume. Compare that to Based, which earns about $0.34 per $1,000 of volume despite driving nearly 18x more total volume.
The difference comes down to the types of trades each builder's users make. Taker orders pay higher fees than maker orders, so a builder code attached to a product where users predominantly take liquidity (market orders, aggressive limit fills) will extract more revenue per dollar of volume than one driving mostly passive maker flow. For builders thinking about their product's fee economics, this distinction matters a lot.
The Power Law Problem: 1,411 Codes, 15 Winners
Here's the uncomfortable reality of the builder code ecosystem. The top 15 codes have generated $74.6 million of the $90.7 million total. That means 1,396 builder codes split the remaining $16.1 million between them, with a long tail trailing off toward near-zero earnings.
This power law isn't surprising. It mirrors every other platform revenue distribution. But it does tell prospective builders something practical: if you're launching a builder code today, you're not competing for share of a homogeneous market. You're fighting for a specific niche, a specific user type, or a specific product angle that lets you accumulate volume from a user segment the top 15 haven't already captured.
The new builder's playbook: You probably won't out-distribute Phantom (153K users) or out-volume Insilico ($36B). Instead, focus on a vertical the big players haven't prioritized, then use analytics to understand exactly which user segments your code attracts and how they trade.
What the Leaderboard Doesn't Show (and How to Find It)
The static leaderboard tells you all-time totals. Useful, but incomplete. What it can't tell you at a glance is whether a builder code is accelerating or decaying, which asset classes its users trade, or how its user base overlaps with specific trader cohorts.
That's where the HyperTracker API comes in. Our /builders/list endpoint lets you pull the full builder leaderboard programmatically, filtered by timeframe (daily, weekly, monthly, or all-time). You can track revenue trends over time, compare user growth rates, and spot new codes gaining traction before they appear on anyone's radar.
A quick example. Pull the weekly leaderboard to see which codes are gaining momentum right now:
curl -X GET \
  "https://ht-api.coinmarketman.com/api/external/builders/list/timeframe/week" \
  -H "Authorization: Bearer YOUR_TOKEN"
The response gives you each builder's revenue, volume, and user count for that timeframe, which means you can compute week-over-week growth rates for any code on the platform.
Combining Builder Data with Cohort Analytics
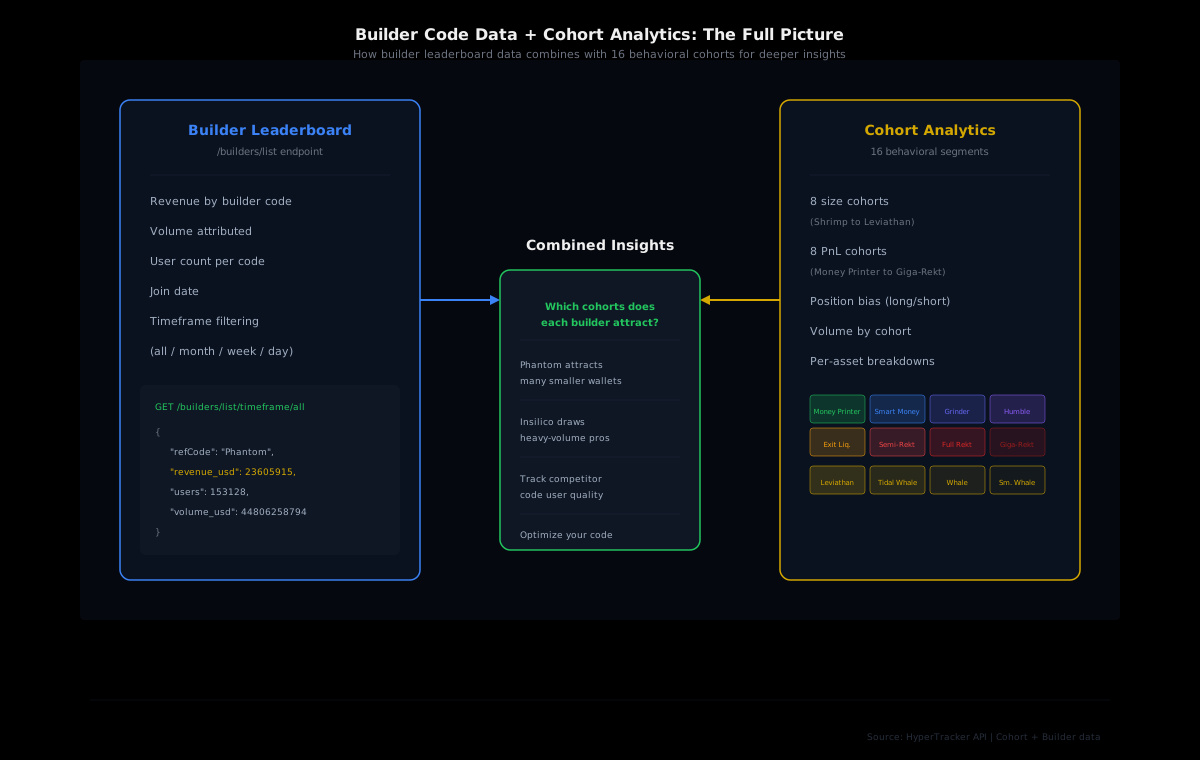
This is where builder code tracking gets genuinely interesting. Our data classifies every wallet on Hyperliquid into one of 16 behavioral cohorts: eight by wallet size (from Shrimp at under 250 USDC in perp equity up to Leviathan at 5M+) and eight by all-time PnL (from Money Printer at over 1M all-time to Giga-Rekt at below negative 1M).
When you combine builder code data with cohort data, you can answer questions that the leaderboard alone never could. Which builder codes attract the most Money Printer wallets? Are the users on a given builder code predominantly large wallets or small retail? Is a code's volume driven by a few Leviathans or by thousands of Fish-tier traders?
That kind of segmentation turns a simple revenue ranking into actionable intelligence. If you're evaluating a competitor's builder code, you can see not just how much volume they do, but what kind of traders they attract. If you're building your own product, you can track which cohorts your code captures and adjust your product to attract higher-value segments.
Building a Builder Code Monitor
For builders who want to track their own performance (or scout competitors), here's a lightweight monitoring pattern using the HyperTracker API.
The core loop is straightforward. Poll the weekly builder leaderboard on a schedule, store the results, and compare periods to spot trends. With three endpoints, you can build a dashboard that shows:
- Revenue trajectory:
/builders/list/timeframe/weekcompared across consecutive weeks - User growth rate: New users per period, calculated from the difference between snapshots
- Volume per user trend: A declining ratio might signal you're onboarding more casual traders, while a rising ratio could mean your power users are trading more aggressively
The API returns data in JSON, which means you can pipe it into anything: a Python script that posts alerts to Slack, a Next.js dashboard for your team, or a Telegram bot that pings you when a competitor's weekly volume spikes.
# Pull all-time and weekly leaderboard in sequence
import requests

headers = {"Authorization": "Bearer YOUR_TOKEN"}
base = "https://ht-api.coinmarketman.com/api/external"

all_time = requests.get(f"{base}/builders/list/timeframe/all", headers=headers).json()
weekly = requests.get(f"{base}/builders/list/timeframe/week", headers=headers).json()

# Compare a specific builder's weekly momentum
target = "YourCode"
for b in weekly:
    if b["refCode"] == target:
        print(f"Weekly revenue: ${b['revenue_usd']:,.0f}")
        print(f"Weekly volume: ${b['volume_usd']:,.0f}")
        print(f"Weekly users: {b['users']}")
The $179/mo Pulse tier gives you 50,000 API requests per month, which is more than enough to poll builder data hourly and still have headroom for cohort queries, position tracking, and whatever else your system needs.
What This Means for the Hyperliquid Ecosystem
The builder code leaderboard is a proxy for something bigger: how Hyperliquid's distribution layer is evolving. When Phantom joined in June 2025 and rapidly climbed to the top of the leaderboard, it signaled that major wallet providers see Hyperliquid perps as a product worth embedding. MetaMask's August 2025 entry and subsequent climb to $8.1 million in revenue reinforced that signal.
But the more interesting trend is the middle of the leaderboard. Codes like Dreamcash, Liquid, and Rabby are all generating $1-2 million in revenue with relatively focused user bases. These aren't mega-wallets with millions of existing users. They're purpose-built products that found a specific segment of Hyperliquid traders and served them well enough to accumulate meaningful volume.
That's the real takeaway for anyone considering building on Hyperliquid today. The distribution play (embed perps in an existing wallet) is largely claimed by the incumbents. But the specialist play, building a tool that serves a particular trader type better than anyone else, is wide open. The 1,411-code ecosystem is big enough to prove the model works, and concentrated enough that a well-executed product can still break into the top tier.
Track Builder Code Performance with Our API
Query the full builder leaderboard by timeframe. Monitor revenue, volume, and user trends for any code. Combine with our 16 behavioral cohorts for deeper user segmentation.
The builder code leaderboard updates continuously, and the strategies that work today will shift as the ecosystem matures. Phantom's $23.6 million proves the ceiling is real. The question for every new builder is which floor they're standing on, and whether their product can generate the volume to climb.