
Bitcoin ETF Inflows Hit Billions. Hyperliquid Whales Moved First.
By CMM Team - 27-Sep-2026
Bitcoin ETF Inflows Hit Billions. Hyperliquid Whales Moved First.
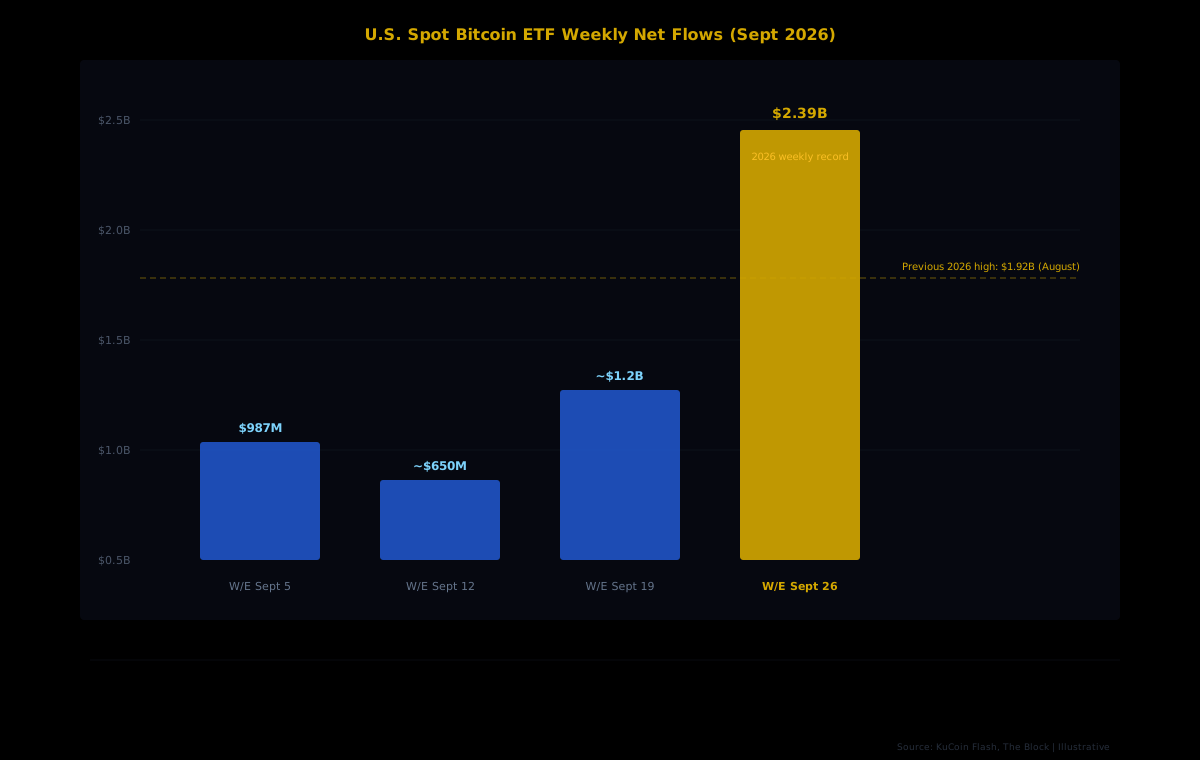
Nearly $1 billion poured into U.S. spot Bitcoin ETFs on September 21, the largest single-day intake of 2026. By Friday the weekly total hit $2.39 billion, obliterating every other week this year and flipping the funds' year-to-date balance back above zero after months in the red.
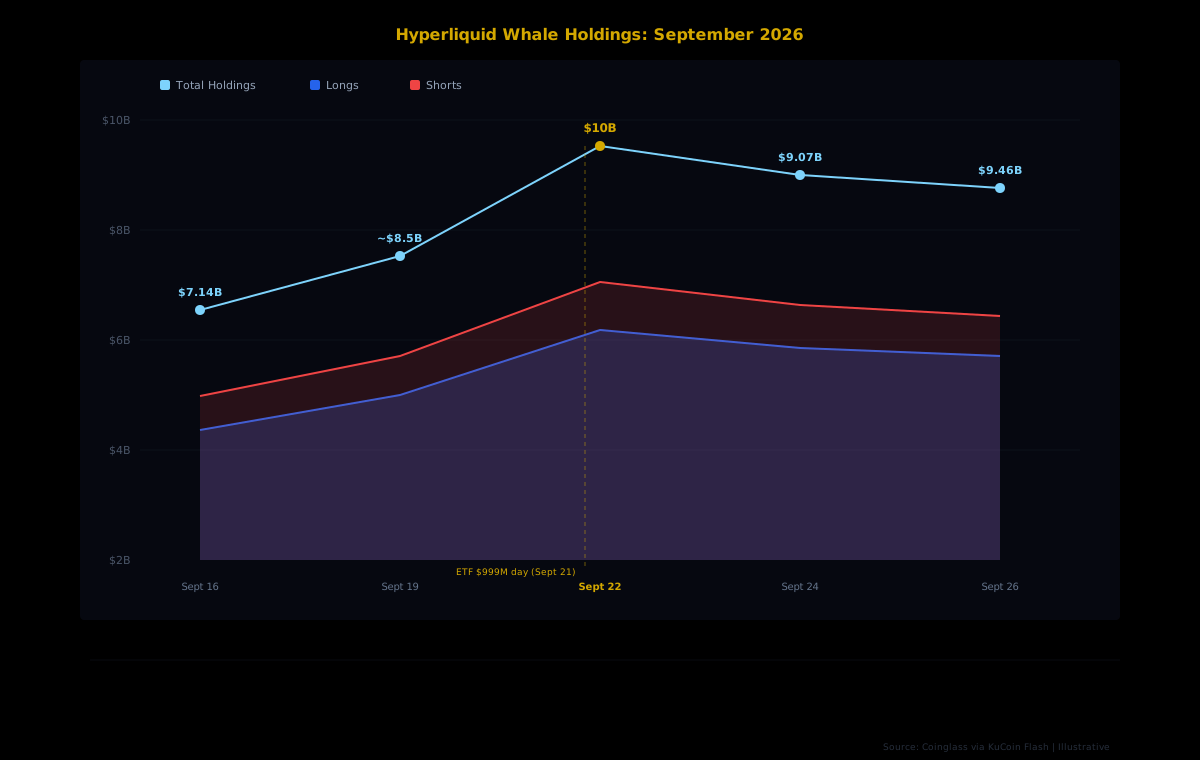
Headlines treated it as the inflection point. But Hyperliquid's largest perpetual futures traders had already placed their bets. Whale holdings on the platform surged from $7.14 billion on September 16 to over $10 billion by September 22, growing by roughly 40% in six days, before the ETF record week was even in the books.
Two signals. Same macro thesis. Completely different timelines. The perp market moved days before the ETF flows confirmed the direction, which raises a question worth examining: can on-chain derivatives positioning give you a structural lead on what traditional finance does next?
The $2.39 Billion Week That Changed the Narrative
U.S. spot Bitcoin ETFs spent most of 2026 bleeding. By mid-July, the funds sat roughly $5.8 billion in the red for the year. Bitcoin had cratered below $58,000, and institutional allocators were pulling capital steadily.
Then the tide turned. August brought $3.52 billion in monthly inflows, the strongest month since September 2025. September accelerated the momentum further.
The week ending September 26 saw $2.39 billion flow into the twelve publicly traded Bitcoin ETFs, surpassing the previous 2026 weekly record of $1.92 billion set in August. Monday accounted for nearly $999 million alone, the ninth-largest daily inflow since these products launched in January 2024.
BlackRock's IBIT led the charge. Fidelity's FBTC and Ark 21Shares' ARKB followed. The cumulative result: year-to-date net flows flipped positive for the first time since January, settling at roughly $934 million in the green. Total net assets across the ETF complex hit $108.42 billion.
Hyperliquid Whales Were Already Loaded
The ETF headlines missed the timing. Five days before that record $999 million Monday, Hyperliquid's largest traders were already scaling into massive positions.
On September 16, total whale holdings on Hyperliquid stood at $7.14 billion, with longs at $3.38 billion (47.27%) and shorts at $3.77 billion (52.73%). By September 22, those holdings had swollen to over $10 billion, a 40% increase in under a week.
The most telling data point: one of Hyperliquid's largest long whales had already opened approximately 1,000 BTC in longs worth roughly $79 million at an average entry of $78,780 back on August 28. By September 22, that position had been partially closed at $87,142, booking $8.52 million in profit. The remaining $170 million in open longs (400 BTC plus 50,000 ETH) still carried roughly $15.57 million in unrealized gains.
This wasn't a reaction to the ETF inflows. It was a position built weeks before those flows materialized. The whale was already in profit by the time the billion-dollar ETF day arrived.
Open Interest Tells the Same Story
It wasn't just individual whale wallets. The broader market structure on Hyperliquid confirmed the build-up. Open interest on the platform hit an all-time high of $18 billion (two-sided) on September 23, surpassing the previous record of $16.36 billion set just four days earlier.
Bitcoin alone accounted for roughly $4.05 billion in open interest, followed by Ether at $3.18 billion and the HYPE token at $2.10 billion. The growth was striking: open interest had climbed by roughly $5 billion from end-of-August levels above $13 billion.
That kind of expansion in open interest doesn't happen passively. It means new capital entering the market, new positions being opened. When it coincides with a strong directional move in price (Bitcoin recovered from under $58,000 to approximately $85,000 over the same period), it signals conviction from traders willing to commit real capital before the institutional flows catch up.
The Timing Gap: Why Perp Traders Lead ETF Flows
This pattern isn't unique to September 2026. Perp market positioning tends to lead ETF flows for a few structural reasons.
Perps trade 24/7, ETFs don't. Bitcoin perpetual futures markets never close. ETFs trade during U.S. market hours and settle on a T+1 basis. A whale building a long position on Hyperliquid at 2 AM UTC on a Saturday doesn't show up in any ETF flow data until Monday at the earliest. That structural gap gives perp positioning a built-in lead time measured in days.
ETF flows are lagging indicators. When BlackRock's IBIT sees $381 million in inflows on a single day, those flows often reflect allocation decisions made at institutional investment committees days or weeks earlier. The perp market, by contrast, reflects real-time conviction from traders who can execute in seconds.
The cost of expressing a view is different. Opening a leveraged perp position requires capital and carries liquidation risk. Buying an ETF share is a comparatively passive allocation. When whale-sized accounts accumulate significant perp exposure, they're taking on concentrated risk, which tends to be more informationally dense than diversified ETF inflows spread across thousands of retail and institutional buyers.
Reading the Signal with Cohort Data
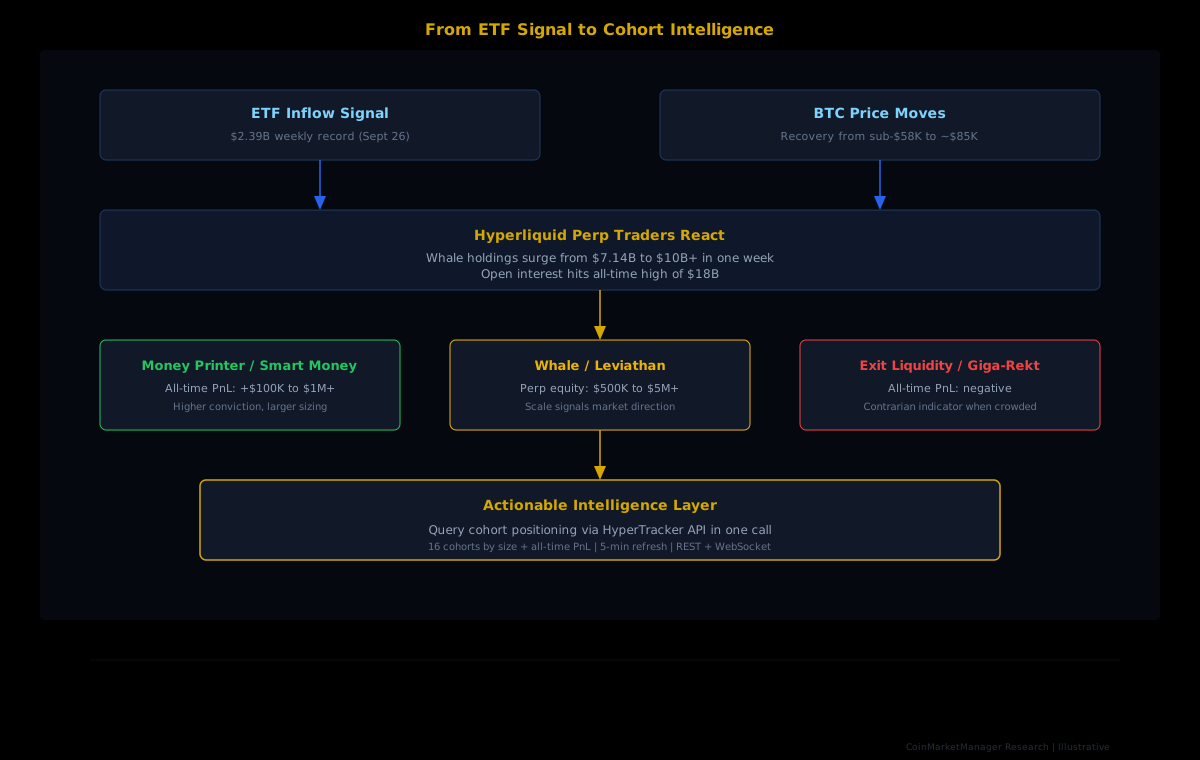
Aggregate whale holdings tell you the direction. Cohort-level analytics tell you who is driving it and how much conviction they carry.
Our data classifies every wallet on Hyperliquid into 16 behavioral cohorts, eight by account size and eight by all-time PnL. When a position build-up like September's happens, the question isn't just "are whales getting long?" The question is which whales.
Consider two different signals:
- Money Printer cohort (all-time PnL above +$1M) accumulating BTC longs: These wallets have a verified track record of profitable trading. When they concentrate in one direction, the signal carries more weight because the capital behind it was earned through repeated correct positioning.
- Giga-Rekt cohort (all-time PnL below -$1M) going heavy long: These wallets have lost significant capital historically. A crowded long position from this group might actually be a contrarian indicator, especially if it diverges from what the profitable cohorts are doing.
Both positions show up as "whale longs" in aggregated data. The cohort layer reveals whether the conviction is coming from wallets that have historically been right or wallets that have historically been wrong. That distinction matters enormously for anyone trying to use positioning data as a directional signal.
Beyond the Snapshot: What to Watch Next
The September data is instructive, but it's a single data point. A few variables will determine whether this pattern holds into Q4:
Fed policy direction. The rate hike to 3.75%-4% on September 16 was bullish for Bitcoin because it signaled the Fed's tightening cycle may be approaching its end. If the next FOMC meeting hints at a pause or cut, expect both perp positioning and ETF flows to accelerate. Watch whether Hyperliquid whales build positions before the announcement, as they did in September.
The $85K resistance level. Bitcoin is testing resistance near $85,000. A clean break above would likely trigger another wave of ETF inflows as momentum-chasing allocators pile in. Whale positioning on Hyperliquid leading into that breakout, or the absence of it, will be more informative than watching the price level alone.
Shorts are still heavy. Despite the bullish surge in total holdings, shorts have consistently outweighed longs on Hyperliquid throughout September, maintaining roughly a 53/47 split. If those shorts start unwinding rapidly, the resulting squeeze could amplify the next leg up. On September 23 alone, roughly $262 million in short positions were forcibly liquidated.
Track Whale Cohort Positioning
HyperTracker's API gives you cohort-level analytics across all 16 behavioral segments: eight by account size, eight by all-time PnL. Query positioning data for any asset on Hyperliquid, refreshed every 5 minutes, through a single API call. Pricing starts at $179/mo.
The Structural Advantage of Watching Both Markets
ETF flows confirm institutional appetite. Perp positioning reveals real-time conviction. Neither signal is complete on its own, but together they form a more robust picture of where capital is heading.
In September, Hyperliquid's largest traders built their positions before the ETF billions arrived. Open interest hit records before the ETF flow data was even published. And the whale who loaded 1,000 BTC at $78,780 was already sitting on $8.52 million in realized profit by the time the ETF record day made headlines.
The institutions showed up eventually. The perp whales just showed up first.