
Half of Hyperliquid Positions Are Underwater. Here's What That Tells You.
By CMM Team - 06-Oct-2026
Half of Hyperliquid Positions Are Underwater. Here's What That Tells You.
Open HyperTracker's Stats page and one number sits right between the total open positions and the count of active traders: Positions in Profit %. On October 13, it read 46.39%, down 1.22 percentage points over the prior 24 hours. That means more than half of the 414,703 open positions across Hyperliquid were sitting at a loss.
Most traders glance at this number, note whether it's above or below 50%, and move on. That's a mistake. The positions-in-profit ratio is one of the clearest crowding and sentiment indicators available on any perp exchange, and because Hyperliquid settles entirely on-chain, you can trust that the number reflects real positions held by real wallets. No opaque exchange reporting. No sample bias.
This guide breaks down what the metric measures, why it moves the way it does, how it behaves at market extremes, and how pairing it with cohort analytics turns a single percentage into a full read on who is hurting and who is comfortable.
What "Positions in Profit" Actually Measures
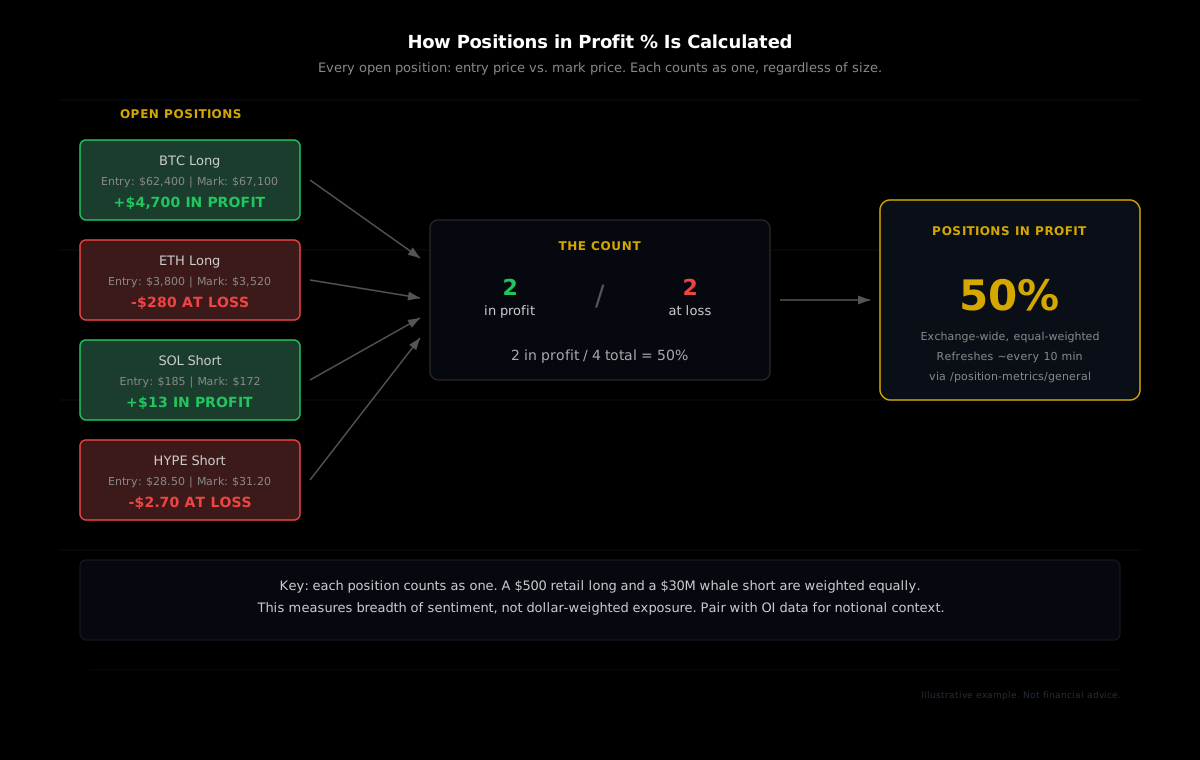
The calculation is straightforward: take every open perpetual futures position on Hyperliquid, compare its entry price against the current mark price, and count how many are in the green. Divide by total open positions. That ratio is what HyperTracker displays on the Stats page.
A few things worth noting about the mechanics. Each position counts as one, regardless of size. A $500 Fish-tier long counts the same as a $30 million Leviathan short. This means the metric reflects the breadth of profit across the market, which is closer to a sentiment measure than a dollar-weighted one. When the number drops below 50%, the majority of positions are underwater, and the typical trader on Hyperliquid is feeling pain.
The number also includes all coins and all position types. BTC longs, ETH shorts, HIP-3 commodity perps, prediction markets: everything feeds into the same denominator. Because Hyperliquid's on-chain architecture records every position transparently, the figure covers the complete exchange rather than a sampled subset.
Why the Ratio Moves with Price
The positions-in-profit percentage is, at its core, a function of price movement relative to the entry distribution of open positions. When the market rallies, longs that were opened at lower prices move into profit while shorts that were opened at higher prices move deeper into loss. The ratio rises. When the market sells off, the reverse happens.
But the relationship isn't perfectly linear, because new positions are constantly being opened and old ones are being closed. A sharp rally might push the ratio to 55%, but if thousands of traders open new longs near the top, those fresh positions start with near-zero unrealized PnL. The next minor pullback pushes all of them underwater at once, and the ratio drops faster than price would suggest.
This creates an asymmetry worth watching. After a sustained move in one direction, the ratio tends to be fragile on reversal because late entrants are concentrated near the extreme. A 2% pullback after a 15% rally can flip a large chunk of positions from green to red in a single state update.
Why this matters for perp traders: A high positions-in-profit reading (above 55%) after a sustained move often signals that new entrants have piled in near the top. The ratio looks healthy, but the entry distribution is top-heavy. Even a modest retracement can cause a rapid flip, as late positions move underwater and early position holders start taking profit.
Extreme Readings and What They Signal
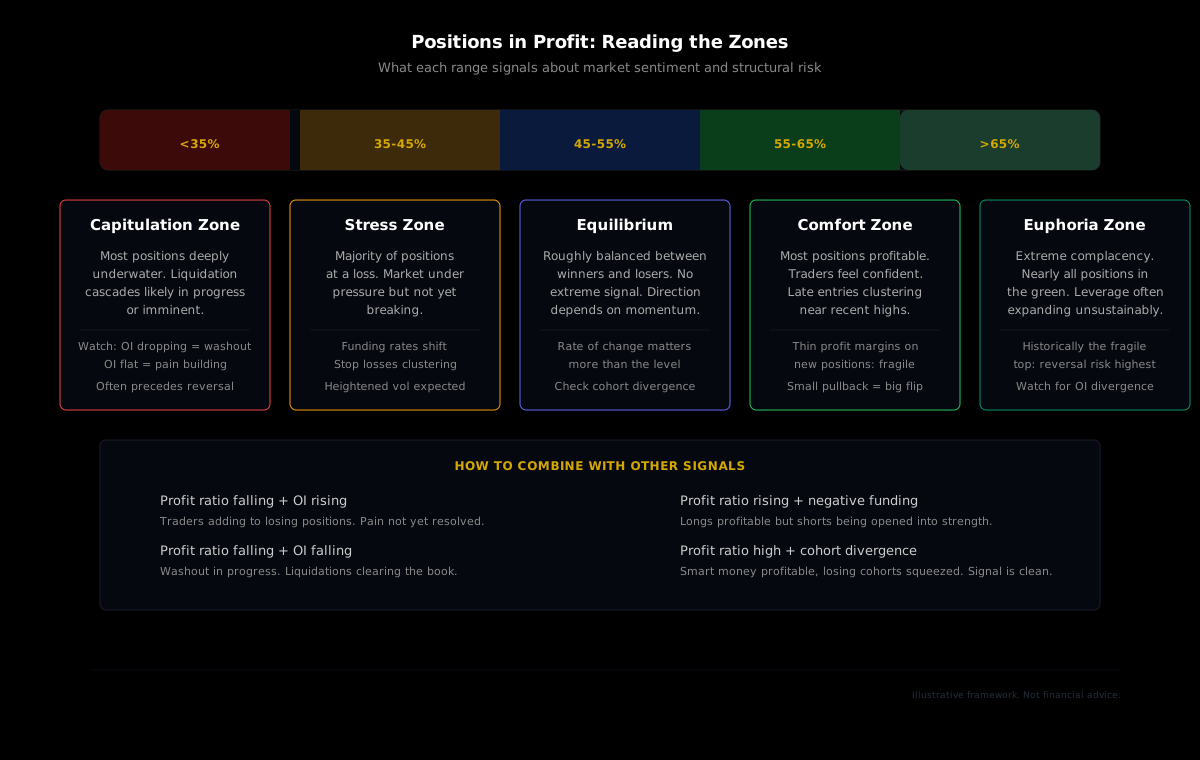
The positions-in-profit ratio becomes most useful at its extremes. When the reading drops below 40%, the market is broadly in pain. Most open positions are underwater, funding pressure from the losing side is high, and the conditions for a short squeeze or a capitulation flush are building, depending on whether the pain is concentrated in longs or shorts.
Low readings (below 40%): pain is widespread
At these levels, the majority of traders are sitting on losses. This doesn't automatically mean a reversal is coming, but it does mean one of two things is likely: either the losing positions get liquidated and closed (clearing the slate), or price reverses enough to relieve the pressure. The metric alone won't tell you which outcome to expect, but it flags that the market is at a decision point.
Pairing a low reading with open interest data adds clarity. If OI is falling while the profit ratio drops, positions are being forcefully closed through liquidations or voluntary stop-outs. That is a washout in progress. If OI is flat or rising while the ratio drops, traders are adding to losing positions or new entrants are immediately going underwater. That is a crowding problem, and the pain threshold hasn't been hit yet.
High readings (above 55%): comfort breeds complacency
When most positions are in profit, the market feels easy. Traders are confident, leverage tends to expand, and the entry distribution clusters near recent prices. This is where pullbacks do the most damage. A broad profit base sounds healthy, but it also means a large number of positions have thin profit margins that a 2-3% move can erase.
Positions in Profit Across Cohorts: Where It Gets Interesting
The exchange-wide positions-in-profit ratio is a blunt tool. It tells you the market's aggregate mood, but it treats a Shrimp ($0-$250 in perp equity) the same as a Leviathan ($5M+). That's where HyperTracker's cohort system adds a layer that raw exchange data cannot provide.
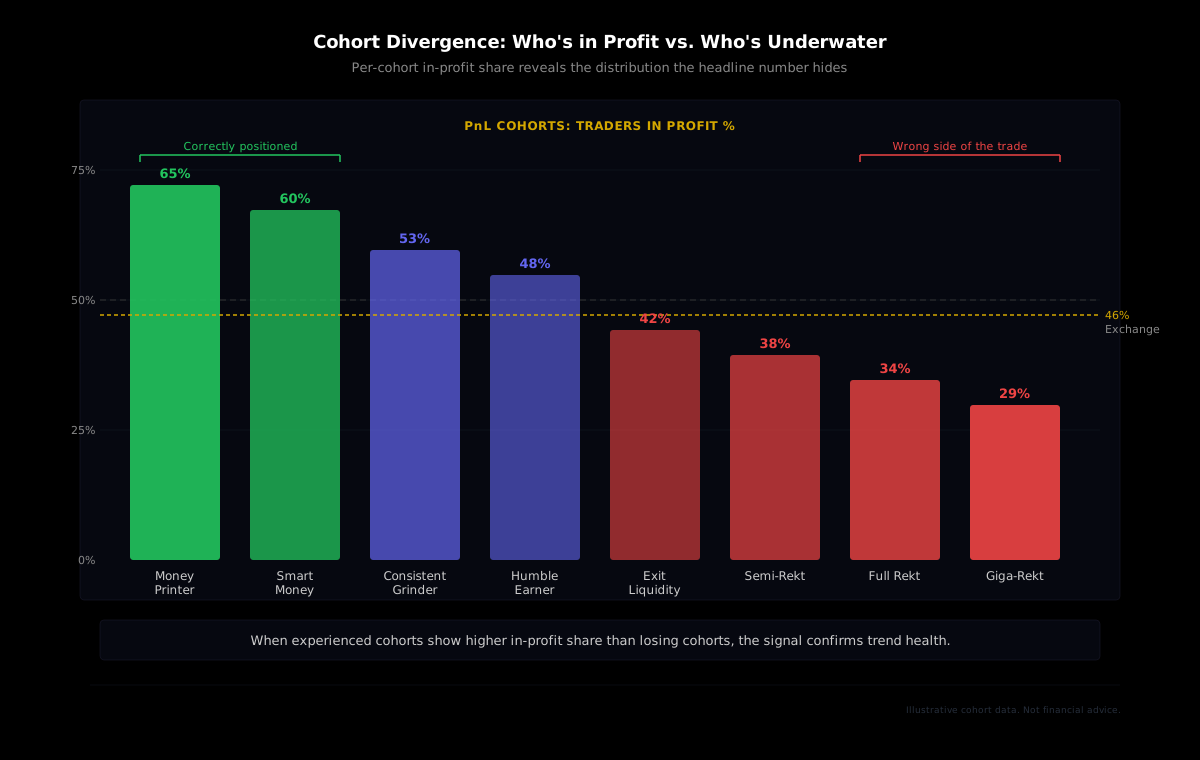
Our data classifies every active wallet on Hyperliquid into 16 behavioral cohorts: 8 by account size (perp equity) and 8 by all-time PnL performance. The cohort summary endpoint returns countTradersInProfit for each segment, which means you can compute the positions-in-profit ratio separately for Money Printers ($1M+ all-time PnL), Smart Money ($100K-$1M), Exit Liquidity (-$10K to $0), and every other tier.
The divergences are where the signal lives. Imagine the exchange-wide ratio sits at 46%, but the Money Printer cohort's in-profit share is 62% while Exit Liquidity sits at 38%. The aggregate number masks a meaningful split: experienced, profitable wallets are positioned well, while historically losing wallets are concentrated on the wrong side. That divergence, between who is in profit and who is not, is a stronger signal than the headline number alone.
Reading the cohort split: When high-PnL cohorts (Money Printer, Smart Money) have a higher in-profit share than low-PnL cohorts (Exit Liquidity, Full Rekt), the "smart" side of the market is positioned correctly. When the split inverts and losing cohorts have the higher share, proceed with extreme caution: historical losers being right usually means the trend is mature and late.
Pulling the Data: API and Dashboard
The positions-in-profit percentage is displayed on the HyperTracker Stats page alongside total open positions and active trader counts. The 24-hour change is shown as a delta, so you can see whether the market's profit breadth is expanding or contracting without pulling historical data.
For programmatic access, the /position-metrics/general endpoint returns a countInProfit field alongside the total position count at each snapshot. Dividing the two gives you the same ratio, with the ability to track it over time by passing a start parameter. Each snapshot refreshes about every 10 minutes.
At the cohort level, /segments/{segmentId}/summary returns countTradersInProfit per cohort, which enables the divergence analysis described above. You can query all 16 segments and compare the in-profit share across the performance spectrum.
| Data Point | Source | Access |
| --- | --- | --- |
| Exchange-wide positions in profit % | Stats page / /position-metrics/general | Dashboard + API (all plans) |
| Per-cohort traders in profit | /segments/{segmentId}/summary | API (all plans) |
| Historical time series (countInProfit) | /position-metrics/general?start=... | API (all plans) |
| Open interest alongside profit ratio | /position-metrics/general | API (all plans) |
Practical Reads: Three Scenarios
The positions-in-profit ratio is most useful when combined with other data points. Here are three recurring setups where the metric adds edge.
Scenario 1: Profit ratio falling while OI rises
Price is dropping, but open interest keeps climbing. Traders are adding new shorts or averaging down on losing longs instead of cutting. The positions-in-profit ratio declines because the new positions enter underwater immediately. This pattern tends to precede either a capitulation flush (if longs are the ones averaging down) or a short squeeze (if shorts are piling in aggressively near the bottom). Watch for a spike in liquidations as the resolution mechanism.
Scenario 2: Profit ratio rising while funding goes negative
Most positions are in profit, but funding rates turn negative. This means shorts are paying longs, despite the majority of positions being green. The likely explanation: the positions in profit are predominantly longs from lower entries, while shorts are being opened into strength. The funding signal says the market expects a pullback even though most existing positions are doing well. When the in-profit ratio is high and funding flips, the market is pricing in a correction before it happens.
Scenario 3: Cohort divergence at extremes
Imagine the exchange-wide ratio sits at 48%, but cohort data shows Money Printers at 60%+ while Exit Liquidity and Giga-Rekt are below 35%. The aggregate number looks middling, but the distribution is skewed: experienced traders are correctly positioned, and historically poor performers are on the wrong side. If the experienced cohorts start reducing exposure while the ratio remains flat, that's early rotation out of profitable positions, a signal that tends to lead price by a state update or two.
Limitations Worth Knowing
No single metric tells the full story, and the positions-in-profit ratio has specific blind spots worth acknowledging.
Equal weighting hides concentration. A thousand Shrimp positions and one Leviathan position each count as one. If the single whale controls more notional value than all thousand retail positions combined, the profit ratio still treats them equally. Pairing with OI data and the /positions/heatmap endpoint compensates for this, because the heatmap breaks down notional value by cohort and coin.
The metric is backward-looking. It reflects the unrealized PnL of current positions, which are the product of past entry decisions meeting today's price. It tells you where pain exists right now, which is genuinely useful for anticipating forced exits and sentiment shifts. But it does not predict direction. Imagine a 40% reading: it can stay at 40% for days if price grinds sideways.
Position churn creates noise. When positions open and close rapidly (common in low-timeframe scalping), the in-profit count fluctuates within each snapshot interval. The ratio is most stable and most informative for positions held beyond a few state updates. Filtering by position age using the positionRecencyTimeframe parameter on cohort endpoints can help isolate longer-held conviction positions from noise.
Track Positions in Profit Across All 16 Cohorts
HyperTracker classifies every Hyperliquid wallet into behavioral cohorts by size and by performance. See who's in profit, who's underwater, and where the smart money diverges from the crowd.
One Number, Read Three Ways
The positions-in-profit ratio is deceptively simple. A single percentage. Above or below the 50% line. Rising or falling.
But layered onto open interest, funding rates, and cohort-level breakdowns, it becomes a tool for reading the market's structural health. It tells you how much pain exists, where that pain is concentrated, and whether the wallets sitting in profit are the ones with a track record of being right.
The next time you check HyperTracker's Stats page and see that number, don't just note it. Ask who's underwater, whether they're the type to hold or fold, and what happens to price when they finally decide.