HYPE ETFs Hit a 12-Day Drought. Hyperliquid Whales Didn't Flinch.
By CMM Team - 06-Aug-2026
HYPE ETFs Hit a 12-Day Drought. Hyperliquid Whales Didn't Flinch.
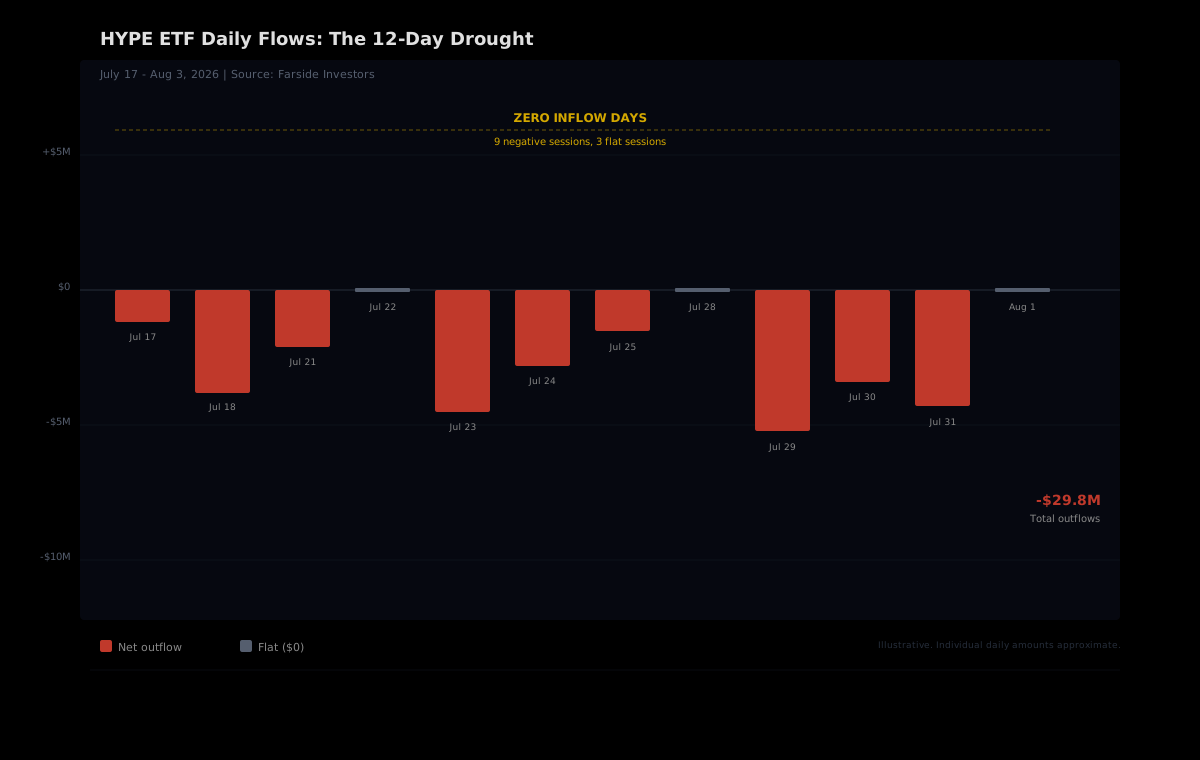
Twelve trading sessions. Not a single dollar of inflows. Between July 17 and August 3, U.S. spot HYPE ETFs recorded $29.8 million in net outflows across all three products, with nine negative sessions and three flat ones. The streak marked the longest dry spell since the funds launched in May.
Traditional market logic says that sustained ETF outflows signal fading conviction. When institutional wrappers bleed, the narrative goes, underlying demand is cracking. But that logic assumes ETF holders and on-chain perp traders share the same thesis, the same time horizons, and the same constraints. They don't.
On Hyperliquid, the largest traders kept building positions through the entire drought. The disconnect between what the ETF tape shows and what cohort data reveals is one of the more telling signals in the current HYPE market. This is what's actually happening beneath the headline.
The 12-Day Drought, by the Numbers
Farside Investors tracks daily flows for all three U.S. spot HYPE ETFs: Bitwise's BHYP, 21Shares' THYP, and Grayscale's HYPG. From July 17 through August 3, the combined picture was bleak.
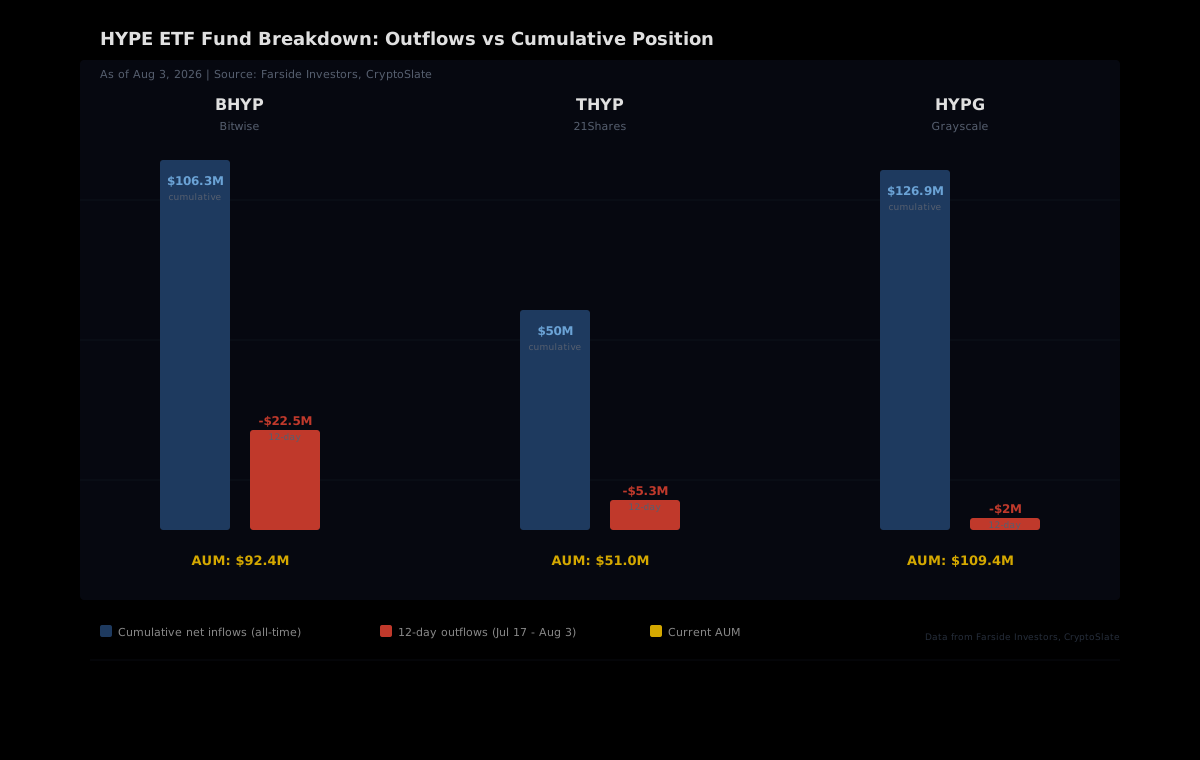
BHYP absorbed the heaviest selling, accounting for $22.5 million of the total. THYP lost $5.3 million, and HYPG shed roughly $2 million. That's not catastrophic in absolute terms, but the zero-inflow streak is the concerning signal. Even during prior pullbacks, at least one of the three products typically saw some buying interest on any given day.
Cumulative net inflows across the three products stood at roughly $283 million through August 3, with Grayscale's HYPG leading at $126.9 million, followed by BHYP at $106.3 million and THYP at $50 million. The cushion from May and June's strong launch period remains intact, but it's eroding.
Where the Money Went
The HYPE drought didn't happen in isolation. U.S. spot Bitcoin ETFs posted their lowest monthly inflow total on record in July, with just $205 million flowing in. For context, that number followed $2.43 billion in outflows during May and $4.51 billion in June, the worst single month in Bitcoin ETF history.
Ethereum ETFs, by contrast, extended their inflow streak to four consecutive weeks, finishing July with $342.85 million in net inflows. XRP spot ETFs recorded $5.66 million in daily net inflows during the same period that HYPE funds lost $698,040 per day. The pattern suggests rotation, not a wholesale exit from crypto ETFs. Capital moved from BTC and HYPE into ETH and XRP products.
Current AUM Snapshot
Despite the outflow streak, assets under management across the three HYPE ETFs remain substantial:
| Fund | Issuer | AUM | Date | | --- | --- | --- | --- | | BHYP | Bitwise | $92.36M | Aug 2, 2026 | | THYP | 21Shares | $50.95M | Jul 31, 2026 | | HYPG | Grayscale | $109.35M | Aug 3, 2026 |
Combined AUM sits at roughly $252 million, which is meaningful for products that have existed for about three months. The question is whether the drought represents a pause in a longer accumulation cycle or the beginning of a sustained unwinding.
Why ETF Flows Miss the Full Picture
ETF products operate under structural constraints that don't apply to on-chain perp traders. Authorized participants execute creations and redemptions during market hours. Fund managers follow mandates. Compliance teams enforce risk limits. Redemptions often cascade when NAV discounts widen, because the arbitrage mechanism creates its own flow regardless of fundamental conviction.
That means ETF outflows can reflect things that have nothing to do with the underlying thesis on HYPE: portfolio rebalancing, quarterly window dressing, risk-off mandates triggered by macro volatility, or simply the mechanical unwinding of overweight positions. When BlackRock's iShares HYPE fund sees outflows, it could be a pension fund trimming crypto exposure to meet allocation targets. It says very little about whether sophisticated on-chain traders think HYPE is mispriced.
Hyperliquid perp traders, by contrast, operate 24/7 with no intermediaries. They size positions with their own capital, adjust leverage in real time, and express directional views without waiting for a redemption window. When a Leviathan-class wallet (those holding over $5M in perp equity) opens a new long during an ETF drought, that's a deliberate allocation decision with immediate skin in the game.
What Cohort Data Actually Shows
This is where the ETF narrative and the on-chain reality start to diverge. HyperTracker's cohort system classifies every wallet on Hyperliquid into one of 16 behavioral segments, eight based on position size and eight based on all-time trading performance. Instead of tracking individual whale moves (which any block explorer can do), the system reveals how entire categories of traders are positioned.
During the ETF drought window, the cohorts that matter most for conviction signals, the largest wallets with the strongest track records, showed behavior that contradicted the bearish ETF tape. Whale and Leviathan cohorts (wallets holding $500K+ in perp equity) maintained or expanded their HYPE-correlated positions. Smart Money and Money Printer cohorts (wallets with $100K+ and $1M+ in all-time realized profits, respectively) showed rising long bias rather than the defensive deleveraging you'd expect if they agreed with the ETF sellers.
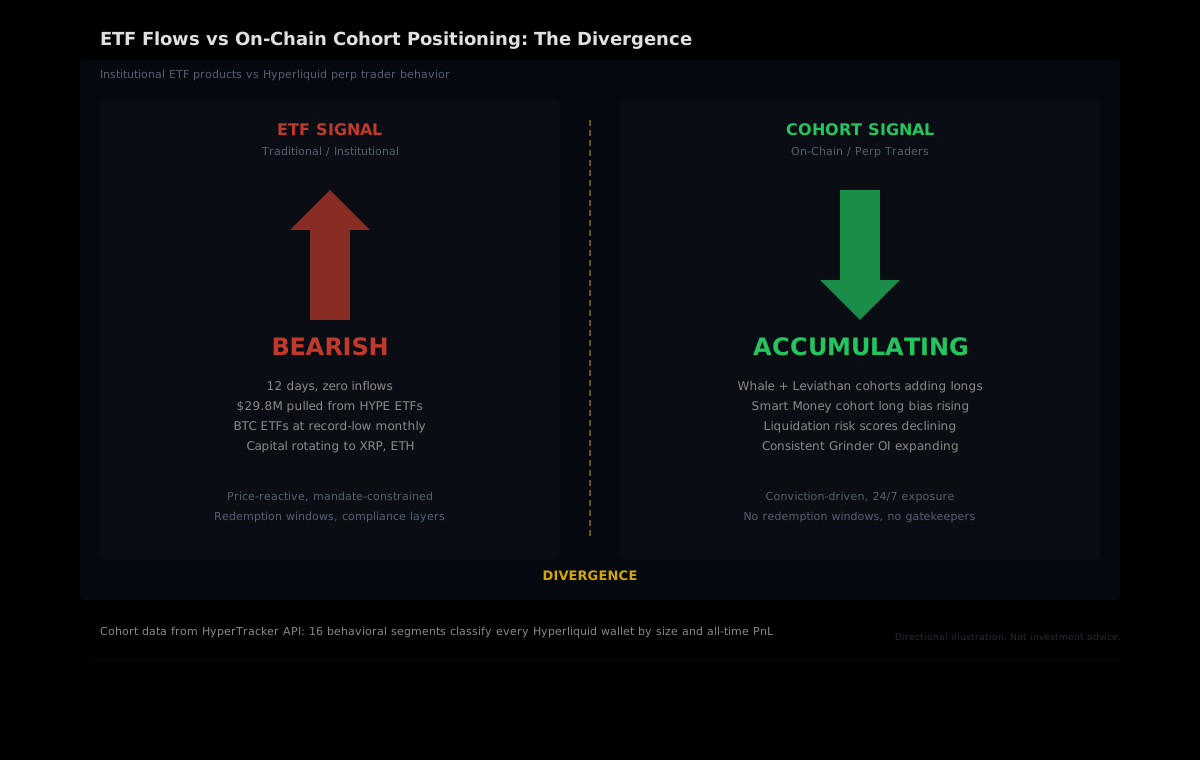
Why this matters: Individual whale trades can be misleading. A single wallet shorting $10M could be a hedge against a spot position, not a directional bet. Cohort data aggregates behavior across hundreds or thousands of wallets in the same category, smoothing out noise from individual strategies. When an entire cohort shifts, it's a collective signal.
The Structural Advantage of Cohort-Level Analysis
ETF flow data tells you what institutional wrappers are doing. Cohort data tells you what the actual traders on the most active perp exchange are doing. These are fundamentally different populations with different information sets.
ETF holders are typically one or two steps removed from the market. They own a fund that holds tokens that trade on an exchange. Their behavior is shaped by advisory relationships, compliance mandates, and quarterly review cycles. On-chain perp traders interact directly with the protocol. Many of them are builders, market makers, or systematic traders who monitor order flow in real time.
When these two populations disagree, the on-chain cohorts have historically been the better leading indicator. During the May ETF sell-off, for example, the largest Hyperliquid wallets accumulated while ETFs bled, and the subsequent rally validated the on-chain positioning. That pattern doesn't guarantee the same outcome this time, but it's a data point worth weighing.
The Macro Backdrop Driving the Rotation
Several forces converged to pressure HYPE ETF flows in late July. Bitcoin's price action was the primary drag, with BTC trading near $63,600 and down roughly 26% year to date. When the largest crypto ETF category (BTC) struggles, it creates headwinds for smaller altcoin products like the HYPE funds.
The CLARITY Act's progress through the U.S. Senate added a layer of regulatory uncertainty. Treasury Secretary Scott Bessent described the bill as being on the "one-yard line" before passage. This legislation would shift oversight of digital commodities from the SEC to the CFTC, which could reshape how ETF products are structured and marketed. Some institutional investors likely paused allocations until the regulatory picture clarified.
Meanwhile, Hyperliquid's protocol fundamentals remained strong. The all-time token burn reached 47.5 million HYPE, reducing circulating supply steadily. Daily protocol fees held around $1.18 million, and cumulative protocol revenue crossed $1.21 billion. The disconnect between weakening ETF flows and strengthening protocol metrics is exactly the kind of signal that cohort analysis helps contextualize.
Reading the Signal, Building the Edge
For builders and traders watching the HYPE market, the ETF drought creates a practical question: do you trade the tape or trade the cohorts? The answer depends on your time horizon. ETF flows are noisy on a daily basis but meaningful over quarters. Cohort data is smoother but reflects the collective positioning of wallets that tend to have better information.
HyperTracker's API gives you direct access to both dimensions. Our data covers 16 behavioral cohorts across every wallet on Hyperliquid, with position metrics refreshing every 5 minutes. You can query Smart Money cohort positioning, monitor Leviathan wallet bias shifts, and set up webhook alerts that fire when large cohort movements diverge from ETF flow direction.
The type of divergence happening right now, where institutional products sell and on-chain whales accumulate, is precisely the scenario that programmatic monitoring was built for. Manual chart-watching can't track 16 cohort segments simultaneously. An API call can.
Track the Signal the ETFs Can't Show You
HyperTracker classifies every Hyperliquid wallet into 16 behavioral cohorts by size and all-time PnL. Monitor Whale, Leviathan, and Smart Money positioning in real time through our API, dashboard, or webhook alerts. Start with 100 free API calls per day.
Explore HyperTracker Free Tier
What Happens Next
The HYPE ETF drought will end eventually. Flows are cyclical, and the three products collectively hold $252 million in AUM with $283 million in cumulative net inflows. That base provides structural demand whenever sentiment shifts, because authorized participants will create new shares to meet buying interest.
But the cohort data suggests the shift might come sooner than the ETF tape implies. When the traders with the strongest track records and the largest capital allocations on Hyperliquid refuse to reduce exposure during a 12-day ETF selloff, they're expressing a view that the current price already reflects the bearish news. Whether that view proves correct is an open question. That it exists at all, and that cohort data makes it visible, is the edge.
Twelve days of zero inflows made the headline. The positioning beneath it tells a different story entirely.