
Hyperliquid Exposure Ratio: How Leveraged Is the Whole Market?
By CMM Team - 05-Oct-2026
Hyperliquid Exposure Ratio: How Leveraged Is the Whole Market?
A market can be calm on the surface and completely overextended underneath. Price is flat, volume is average, funding is hovering near zero. Everything looks normal. But if you check the exposure ratio and it reads 5.2x, that market is carrying five dollars of open interest for every dollar of perp equity. One sharp move and the liquidation cascade starts before anyone changes their thesis.
The exposure ratio is the single number that tells you how leveraged the entire Hyperliquid market is at any given moment. It is total open interest divided by total perp equity across all wallets. It answers a question that price action alone cannot: how much heat is this market carrying right now?
This article covers what the exposure ratio measures, why it matters more than individual leverage readings, how to read it at the cohort level to see which groups of traders are running heavy, and how to pull it from the HyperTracker API or the Stats page to add it to your own market read.
What the exposure ratio actually measures
The formula is straightforward:
Exposure Ratio = Total Open Interest / Total Perp Equity
Open interest is the aggregate dollar value of all outstanding perpetual positions on Hyperliquid. Perp equity is the total collateral (margin plus unrealized PnL) sitting in perpetual accounts across the exchange. Divide the first by the second and you get the market-wide effective leverage.
An exposure ratio of 1.0x means positions exactly equal collateral. Every dollar of open interest is backed by one full dollar of equity. That is a low-leverage, conservatively positioned market. An exposure ratio of 4.0x means the market is running four dollars of notional for every dollar of collateral. That is more typical and reflects the normal leverage traders use on perpetual futures.
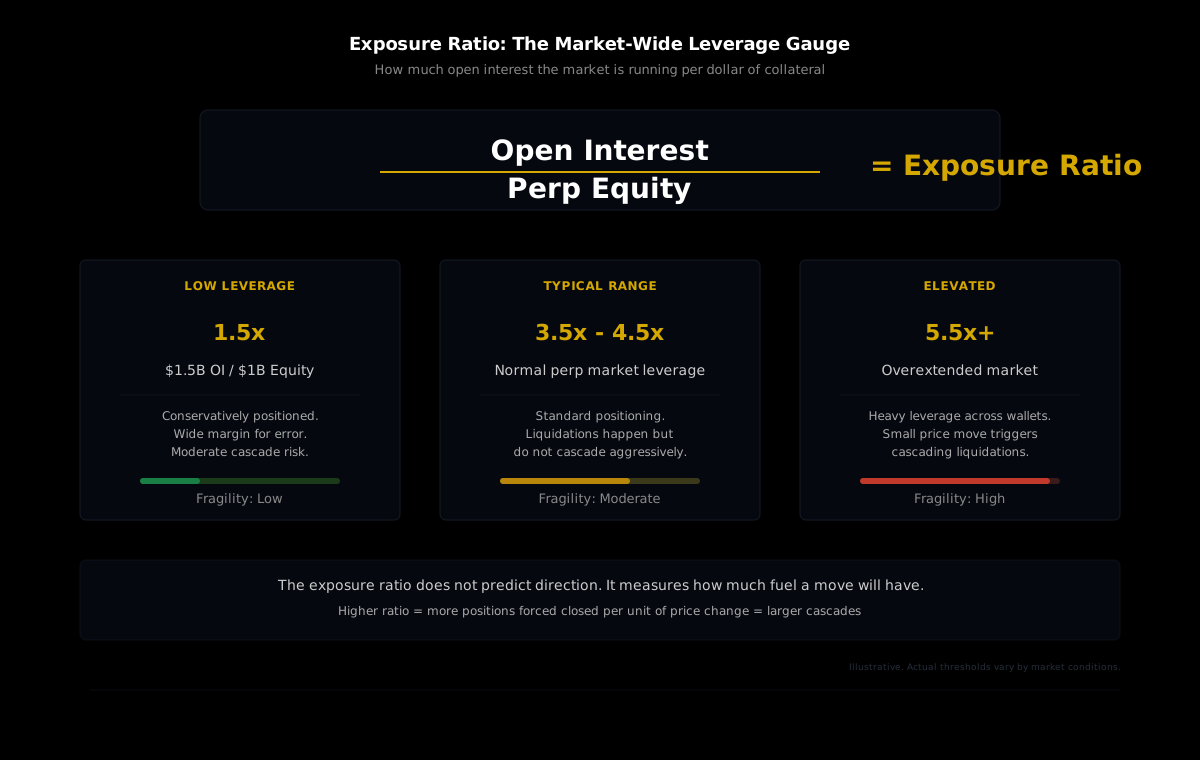
The critical insight is that this is not the leverage of any single trader. It is the aggregate leverage of the entire market. Individual traders can run 20x or 50x positions, but if the rest of the market is lightly positioned, the exchange-wide exposure ratio stays moderate. Conversely, if thousands of wallets are each running modest leverage, the aggregate can still climb to dangerous levels through sheer volume of positions.
You can see the current exposure ratio on HyperTracker's Stats page at app.coinmarketman.com/hypertracker/stats, displayed as "Exposure Ratio Distribution: Open Interest vs Perp Equity" with the current reading and its 24-hour change.
Why aggregate leverage beats individual readings
Most traders think about leverage as a personal setting. You choose 5x, 10x, 20x when opening a position, and that number tells you how amplified your PnL will be. That is accurate for risk management on your own position. It tells you nothing about the broader market's vulnerability.
The exposure ratio fills that gap. When the market-wide ratio climbs, it means the total value of outstanding positions is growing faster than the collateral backing them. More traders are extending further, or the same traders are adding to positions without adding margin. Either way, the system as a whole becomes more fragile.
This matters because liquidation cascades are collective events. When a price move triggers liquidations, those forced closes push price further in the same direction, which triggers more liquidations. The severity of the cascade is proportional to how levered the market was before the move started. A market at 2.5x aggregate exposure will absorb a 3% price drop with modest liquidation volume. The same market at 5.5x will see cascading liquidations amplify the move.
The exposure ratio is the fire indicator for the market's powder keg. It does not predict which direction the spark comes from. It tells you how explosive the reaction will be when it arrives.
Reading the ratio alongside price and OI
The exposure ratio gains its full value when you read it in context with open interest direction and price direction. Here is how the combinations break down:
| Exposure Ratio | OI Direction | What It Tells You | Risk Level | | --- | --- | --- | --- | | Rising | Rising | New positions entering at higher leverage. Market extending. | ELEVATED | | Rising | Flat | Collateral leaving while positions stay open. Wallets withdrawing margin. | ELEVATED | | Flat | Rising | OI growing but collateral growing in proportion. Healthy expansion. | NORMAL | | Falling | Falling | Positions closing. De-leveraging in progress, may be post-cascade. | RECOVERY | | Falling | Flat | New collateral flowing in. Market strengthening its base. | HEALTHY |
The most dangerous combination is a rising exposure ratio during a trending market. In a sustained uptrend, traders tend to add to positions and use unrealized profits as margin for new entries. The exposure ratio climbs because notional is growing faster than fresh equity deposits. As long as the trend continues, the structure holds. The moment it reverses, the unrealized profit evaporates, the effective margin shrinks, and the ratio spikes even higher right before the cascade begins.
The healthiest structure is a falling exposure ratio with stable or rising OI. That means open interest is being backed by more collateral per unit. Positions may be growing, but the margin base is growing faster. It reflects a market where participants are adding equity and maintaining discipline.
Cohort-level exposure: where the real signal lives
The exchange-wide exposure ratio is a useful macro gauge, but it hides a critical question: which cohorts are driving the leverage?
Our data breaks this down through the /segments/{segmentId}/bias-history endpoint, which returns exposureRatio as part of each snapshot's data structure. Every row in the history includes the ratio for that specific cohort at that point in time. You get 16 readings, one per cohort, each showing how leveraged that particular group of traders is running.
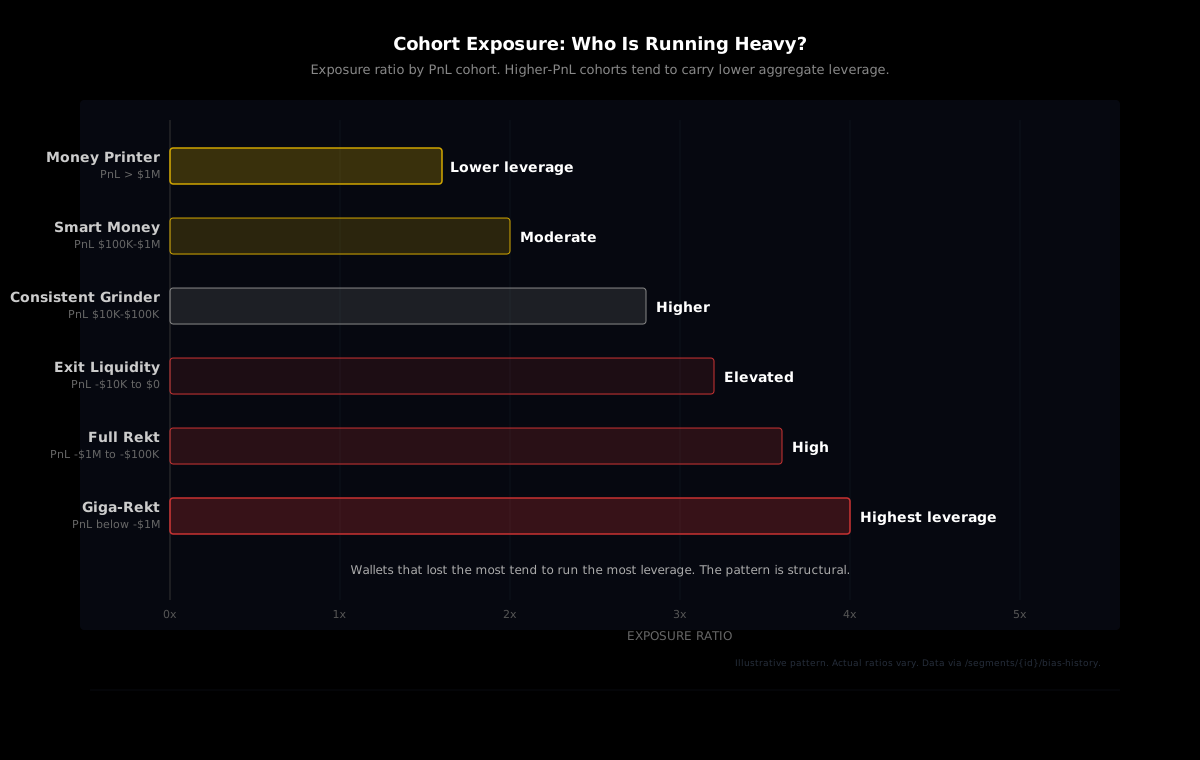
The pattern that tends to repeat: the highest-PnL cohorts (Money Printer, Smart Money) run lower exposure ratios than the losing cohorts (Full Rekt, Giga-Rekt). Successful traders use less leverage on average than unsuccessful ones. That is not a coincidence. Lower leverage means wider margin for error, slower liquidation, and more time to be right. Higher leverage means tighter stops, faster liquidation, and less room for the trade to work.
When you see the aggregate exposure ratio climbing but Money Printer exposure staying flat, that tells you the leverage increase is being driven by lower-PnL cohorts. Historically, when retail pushes the ratio higher while smart money holds steady, the subsequent unwind is more painful because the positions driving the leverage are in the weakest hands.
The reverse is notable too. When Money Printer exposure starts climbing, it means the most profitable wallets on the exchange are choosing to take on more risk. That does not guarantee the trade works, but it carries weight because those wallets earned their cohort classification by being right more often than wrong.
Pulling exposure ratio from the API
There are two ways to access exposure ratio data: the HyperTracker Stats page in the dashboard, and the API.
Dashboard
The Stats page at app.coinmarketman.com/hypertracker/stats shows the exchange-wide exposure ratio with its 24-hour change. No API key required. This is the quickest way to check the current state before a trading session.
API: per-cohort exposure over time
For per-cohort exposure history, use the GET /segments/{segmentId}/bias-history endpoint. The response includes an array of snapshots where each row follows the structure defined by historySnapshotStructure:
[timestamp, bias, exposureRatio, openValue, openLongValue, openShortValue, activePerpEquity]
Here is a practical example that pulls the exposure ratio for the Money Printer cohort (segment ID 8) and the Giga-Rekt cohort (segment ID 15) over the last 7 days:
import requests
from datetime import datetime, timedelta

API_BASE = "https://ht-api.coinmarketman.com/api/external"
headers = {"Authorization": "Bearer YOUR_JWT_TOKEN"}

# Pull 7 days of exposure ratio for two cohorts
start = (datetime.utcnow() - timedelta(days=7)).strftime("%Y-%m-%dT%H:%M:%S.000Z")

cohorts = {
    "Money Printer": 8,   # All-time PnL > $1M
    "Giga-Rekt":     15,  # All-time PnL below -$1M
}

for name, seg_id in cohorts.items():
    resp = requests.get(
        f"{API_BASE}/segments/{seg_id}/bias-history",
        headers=headers,
        params={"start": start}
    ).json()

    # historySnapshotStructure:
    # [timestamp, bias, exposureRatio, openValue,
    #  openLongValue, openShortValue, activePerpEquity]
    history = resp.get("history", [])
    if history:
        latest = history[0]  # newest first
        exposure = latest[2]  # exposureRatio is index 2
        print(f"{name}: exposure ratio = {exposure:.2f}x")
The endpoint returns data at roughly 2-hour intervals by default. With a start parameter set, you get snapshots going back to July 2025. That is enough history to see how cohort leverage patterns have evolved over multiple market cycles.
A more complete analysis would loop through all 16 cohorts and plot the exposure ratios side by side, but the Money Printer vs. Giga-Rekt comparison captures the core divergence signal. The free tier at 100 requests per day supports daily checks across several cohorts without hitting the limit.
Building a leverage warning into your workflow
The most direct way to use the exposure ratio is as a filter before entering trades. High exposure ratio does not mean "do not trade." It means "the market is fragile, so size accordingly."
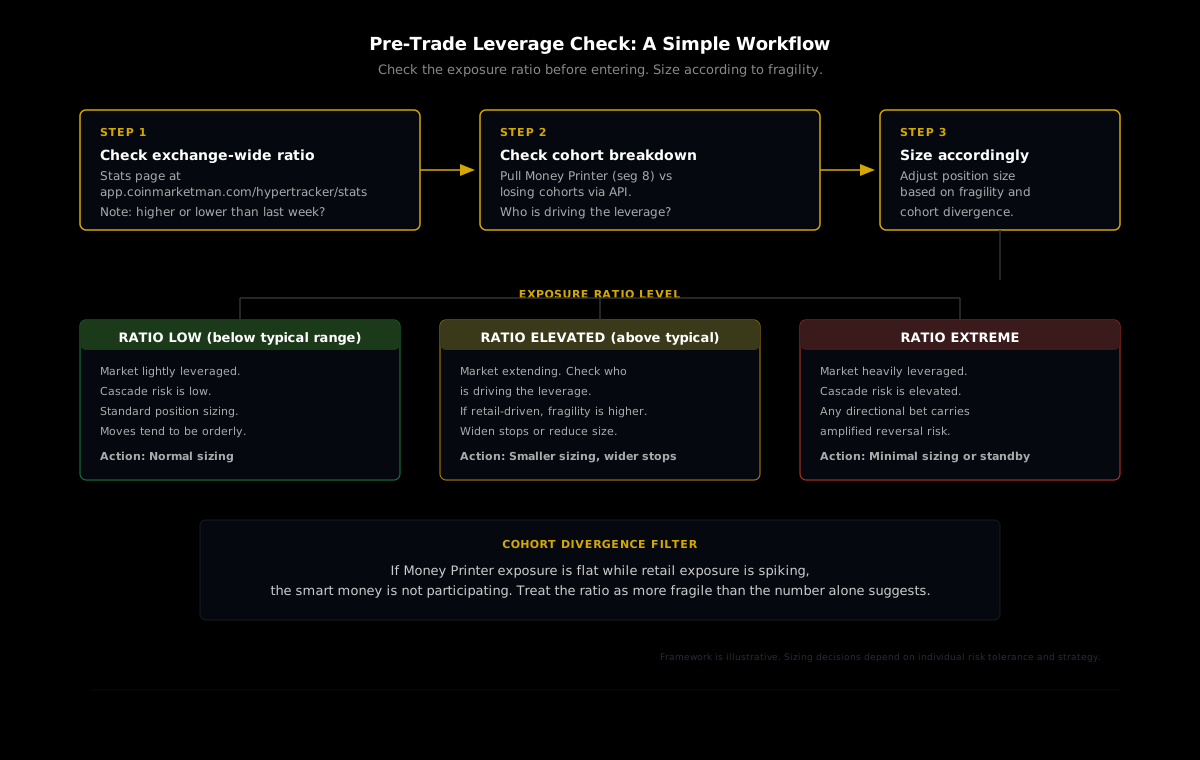
A simple framework:
- Check the exchange-wide exposure ratio on the Stats page before your trading session. Note whether it is higher or lower than where it has been over the past week.
- Check the cohort breakdown. Pull exposure ratios for Money Printer (segment 8) and one or two losing cohorts. If retail leverage is elevated and smart money leverage is flat, the fragility is concentrated in weak hands.
- Adjust position sizing based on fragility. When aggregate exposure is elevated and driven by retail, the probability of a sudden cascade is higher. That does not tell you the direction of the move. It tells you the magnitude will be amplified. Size smaller when the ratio is elevated, or widen stops to account for the increased volatility a liquidation cascade would produce.
The exposure ratio updates roughly every 30 minutes through HyperTracker's state refresh cycle. For traders who hold positions for hours or days, a pre-session check is sufficient. For builders constructing automated systems, the /segments/{segmentId}/bias-history endpoint provides the time series needed to build thresholds and alerts programmatically.
What the ratio cannot tell you
The exposure ratio is a structural metric. It shows how leveraged the market is, but it says nothing about which direction the unwind will go. A market at 5x aggregate exposure can unwind with a long squeeze (longs get liquidated, price drops) or a short squeeze (shorts get liquidated, price spikes). The leverage itself is fuel. The spark determines direction.
It also does not account for position distribution. A 4x aggregate ratio where most of the notional sits in BTC and ETH represents a different risk profile than 4x where the notional is concentrated in illiquid HIP-3 markets. The same leverage on a thin market creates significantly more cascade risk because there is less liquidity to absorb forced closes.
Finally, the ratio is a snapshot. It tells you where things stand right now, but leverage conditions can change quickly. A whale depositing a large equity sum can drop the ratio meaningfully in a single state update. A large position opening without new equity can spike it. Treat the ratio as a current-state thermometer. It measures conditions right now, not future moves.
Every trader has a mental model of how much risk the market is carrying. Most of the time, that model is based on price action and gut feel. The exposure ratio replaces the guess with a number. That number is blunt, but it is honest, and it is the same number that determines whether a 2% price move creates a ripple or a tsunami.
Check the exposure ratio before your next trade
The Stats page shows exchange-wide leverage in real time. The API breaks it down by cohort with months of history. Free tier includes 100 requests per day, no credit card required.