
Hyperliquid Vaults Ranked by What Depositors Actually Earn
By CMM Team - 07-Oct-2026
Hyperliquid Vaults Ranked by What Depositors Actually Earn
Hyperliquid's vault leaderboard sorts by TVL. The biggest vaults sit at the top, which makes them look like the best vaults. That assumption has a problem: TVL measures how much capital a vault attracted, which says nothing about how much it returned per person who deposited into it.
A vault holding $180 million that generates modest daily returns dilutes those gains across thousands of depositors. A smaller vault running a tighter strategy with twenty depositors can deliver dramatically more per person, even if its total PnL is a fraction of the giant's. The metric that captures this is average PnL per depositor, and it reshuffles the rankings in ways TVL alone never reveals.
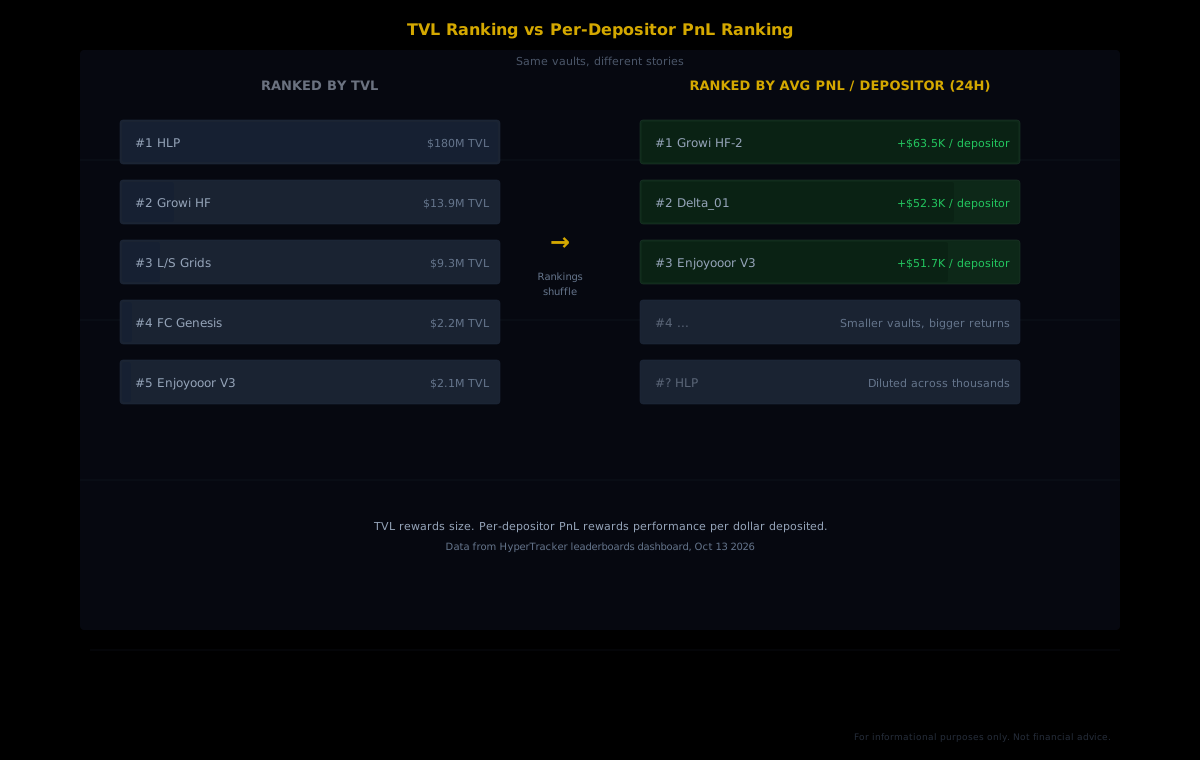
Our leaderboards page includes a "Vaults by Avg PNL per Depositor" tile that ranks vaults exactly this way, across 24-hour, 7-day, 30-day, and all-time windows. On October 13, the 24-hour leaders were Growi HF-2 at +$63.5K per depositor, Delta_01 at +$52.3K, and Enjoyooor V3 at +$51.7K. None of those would top a TVL-sorted list. All of them out-earned the largest vaults on a per-depositor basis by a wide margin.
Why TVL Became the Default Vault Metric
TVL is the first number most aggregators show because it is simple to calculate and universally available. Every vault's balance is on-chain, readable by anyone. It also signals trust: a vault with tens of millions in deposits suggests that experienced capital has done its own due diligence and decided the strategy is worth the risk. So TVL became a proxy for quality.
The proxy breaks down for the same reason market capitalization breaks down for evaluating companies. A large-cap stock can underperform a small-cap stock for years. A $50M vault can underperform a $2M vault on every return metric that matters to the depositor. TVL tells you about inflows. It says nothing about outcomes.
On Hyperliquid specifically, TVL can be misleading for two additional reasons. First, the protocol's flagship HLP vault holds roughly $180 million, which dwarfs every user vault. Its returns are generated by market-making and liquidation backstopping across every listed perp, but those returns are split across a massive depositor base. HLP charges no performance fee, which helps, but the sheer denominator suppresses per-depositor earnings during quiet market periods. Second, HLP's TVL has fallen from a peak of roughly $604 million, meaning that TVL itself is not a stable indicator of confidence. Capital leaves when returns disappoint, regardless of how much was there before.
Per-Depositor PnL Changes the Picture
When you sort vaults by average PnL per depositor instead of TVL, the leaderboard reshuffles. Vaults with concentrated depositor bases and strong strategy performance move to the top. Vaults with massive TVL but diluted returns slide down.
The October 13 snapshot makes this concrete. Growi HF-2 led the 24-hour rankings with +$63.5K per depositor. That number reflects a day where the vault's strategy generated outsized returns relative to its depositor count. Delta_01 followed at +$52.3K, and Enjoyooor V3 at +$51.7K.
These numbers shift daily, because per-depositor PnL is a real-time reflection of strategy performance across the depositor base. That volatility is the point. Unlike TVL, which moves slowly as deposits trickle in or out, per-depositor PnL updates with every trade the vault leader executes. You see outcomes, in near-real time, normalized by the number of people sharing those outcomes.
The TVL Trap in Practice
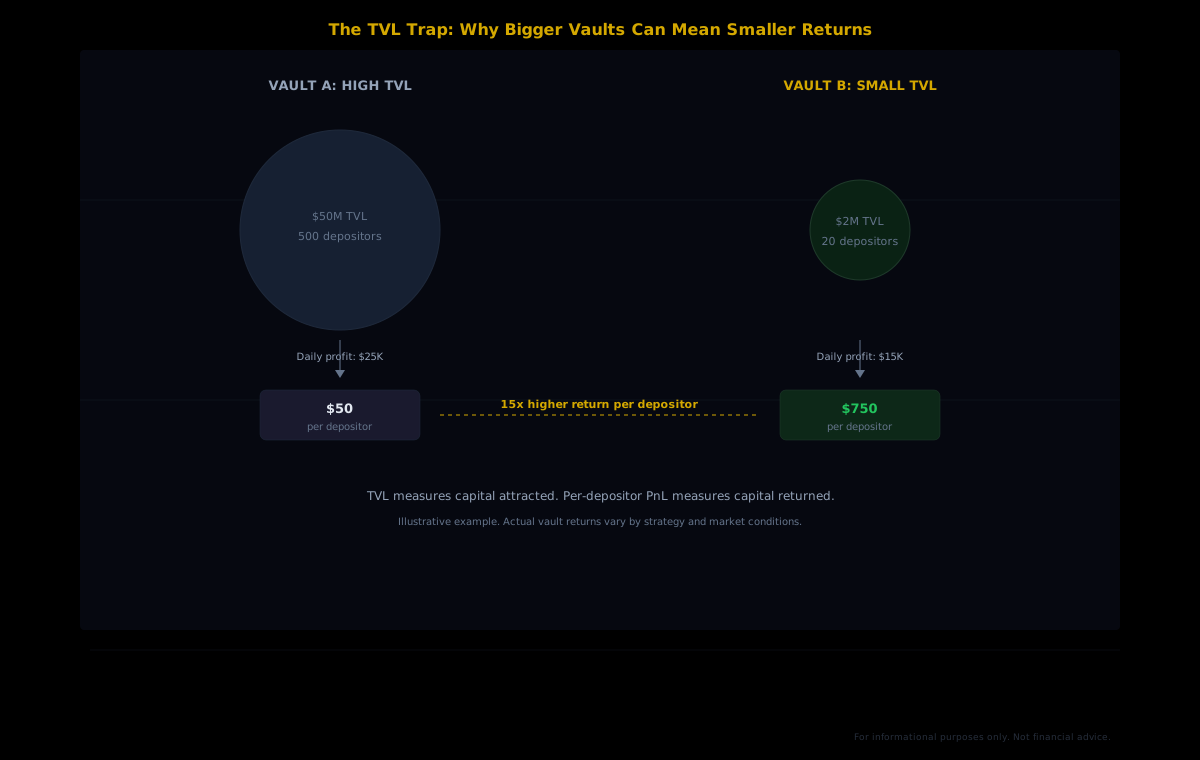
Consider two hypothetical vaults. Vault A holds $50 million across 500 depositors. Its strategy earns $25,000 on a given day. Each depositor's share: $50. Vault B holds $2 million across 20 depositors. Its strategy earns $15,000 that same day. Each depositor's share: $750. Vault A dominates every TVL leaderboard. Vault B dominates the per-depositor PnL leaderboard.
This is not a quirk. It reflects a genuine structural dynamic in how Hyperliquid vaults operate. User vaults require the leader to maintain at least 5% of the vault's total value as their own deposit, which aligns incentives but also means smaller vaults tend to have leaders with a higher personal stake relative to total TVL. Those leaders often run more aggressive or specialized strategies because they have real capital at risk and fewer depositors diluting the result.
The 10% performance fee on user vaults also creates an interesting dynamic. A vault leader running a concentrated strategy with high per-depositor returns earns more in absolute fees than a large vault generating mediocre per-depositor returns, because the fee is 10% of the profit, and concentrated profit per depositor means higher total profit relative to the effort of running one vault.
Reading the Timeframes Correctly
Our leaderboards page offers four timeframes for vault rankings: 24h, 7d, 30d, and All. Each tells a different story, and using just one is a mistake.
24-hour
The most volatile window. A vault can top the 24h chart after one exceptional trade and never repeat it. Useful for spotting momentum, but unreliable as a standalone signal. The October 13 snapshot (Growi HF-2 at +$63.5K) is a single day's result. You need more context before drawing conclusions.
7-day and 30-day
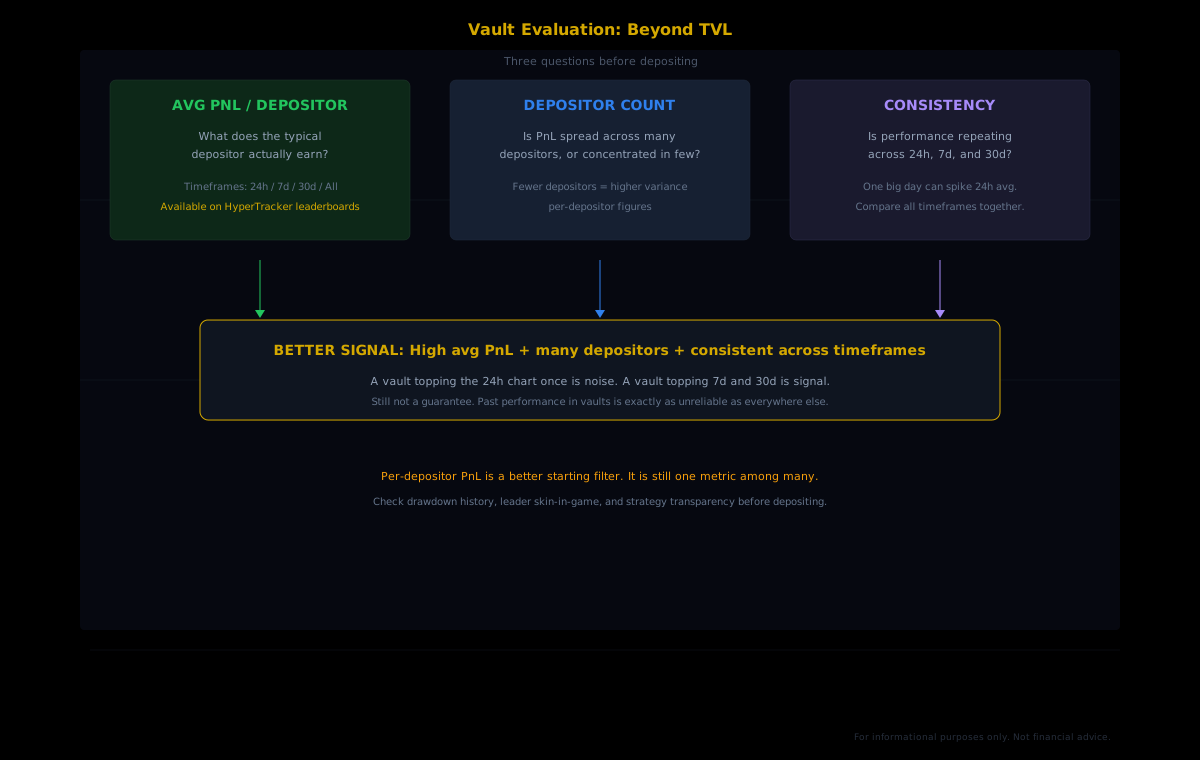
These windows smooth out single-day spikes and give you a better picture of consistency. A vault that appears in the top five across both 7d and 30d is demonstrating repeatable performance, which is a stronger signal than a single extraordinary day. The difference between a lucky trade and a reliable strategy usually shows up in these longer windows.
All-time
The longest view, and the one most susceptible to survivorship bias. Vaults that have been running for a year have had more time to accumulate per-depositor PnL, which can make newer but better-performing vaults look worse by comparison. Use it alongside the shorter windows for context.
Practical approach: Start with the 30-day view to identify vaults with consistent per-depositor returns. Cross-reference against the 7-day view to check for recent momentum. Then look at the 24-hour view to see if performance is continuing or fading. A vault that ranks well across all three timeframes is a stronger candidate than one that spikes on a single day.
What Per-Depositor PnL Doesn't Tell You
Per-depositor PnL is a better filter than TVL. It is still one metric, and treating it as the only metric leads to different mistakes.
Drawdown risk is invisible. A vault showing +$50K per depositor over 30 days might have experienced a -$30K drawdown in the middle of that period. The average PnL number smooths over that valley. If you deposited at the wrong moment, your experience would look nothing like the average. Check the vault's PnL chart on Hyperliquid for drawdown history before depositing.
Depositor count matters. A vault with two depositors showing +$100K average PnL per depositor is a different animal from a vault with fifty depositors showing the same number. Fewer depositors means higher concentration risk, and the "average" becomes less meaningful because one large depositor can skew the math. Look at depositor count alongside the PnL figure.
Strategy risk is unquantified. A vault running a directional momentum strategy may generate exceptional per-depositor PnL during trending markets and lose aggressively during choppy ones. A market-making vault may show lower but more consistent per-depositor returns. The PnL number alone does not tell you how much risk the strategy is taking to generate those returns.
Past performance is past performance. This applies to vaults exactly as it applies everywhere else. A vault topping the 30-day per-depositor PnL chart does not guarantee it will continue doing so. Strategies degrade, market regimes shift, and vault leaders can change their approach at any time.
Combining Per-Depositor PnL with Other Signals
The most useful approach combines per-depositor PnL with several other data points, all available on the vault's Hyperliquid page or through our leaderboards dashboard.
- Leader skin-in-the-game. Vault leaders must hold at least 5% of the vault, but some hold far more. A leader with 30% of the vault's capital in their own deposit has a very different risk profile from one sitting at the minimum. Higher personal stake generally aligns the leader's incentives more tightly with depositors.
- Strategy transparency. Some vault leaders describe their strategy in the vault's on-chain description. Others are opaque. Transparency is not a guarantee of quality, but it lets you evaluate whether the strategy matches your risk tolerance before depositing.
- Lockup awareness. User vaults lock deposits for 1 day after the most recent deposit. HLP locks for 4 days. During that window, you cannot withdraw if the strategy turns against you. Factor this into your sizing.
- Drawdown history. Look at the vault's PnL curve on Hyperliquid. A vault with a smooth upward curve and shallow drawdowns is operationally different from one that spikes and crashes. Per-depositor PnL shows you the destination. The PnL curve shows you the ride.
Where to Find Per-Depositor Vault Rankings
The "Vaults by Avg PNL per Depositor" tile lives on our leaderboards page. It ranks every vault by average PnL per depositor across all four timeframes (24h, 7d, 30d, All), so you can compare vaults on the metric that reflects what depositors actually experience.
This is a dashboard feature, built for browsing and comparison. Pair it with Hyperliquid's native vault pages for drawdown data and strategy descriptions to build a more complete picture.
Rank Vaults by Depositor Returns
Our leaderboards page sorts Hyperliquid vaults by average PnL per depositor across 24h, 7d, 30d, and all-time windows. See which vaults return the most per person.
TVL will always be the first number people check because it is the simplest to find. But the depositors who do well in vaults tend to be the ones asking a different question: not "where is the most capital?" but "where is the most capital being returned, per person?" The leaderboard already answers that. Most people just never sort by it.