
Revenue Per User: The Metric Top Hyperliquid Builders Actually Watch
By CMM Team - 22-Jul-2026
Revenue Per User: The Metric Top Hyperliquid Builders Actually Watch
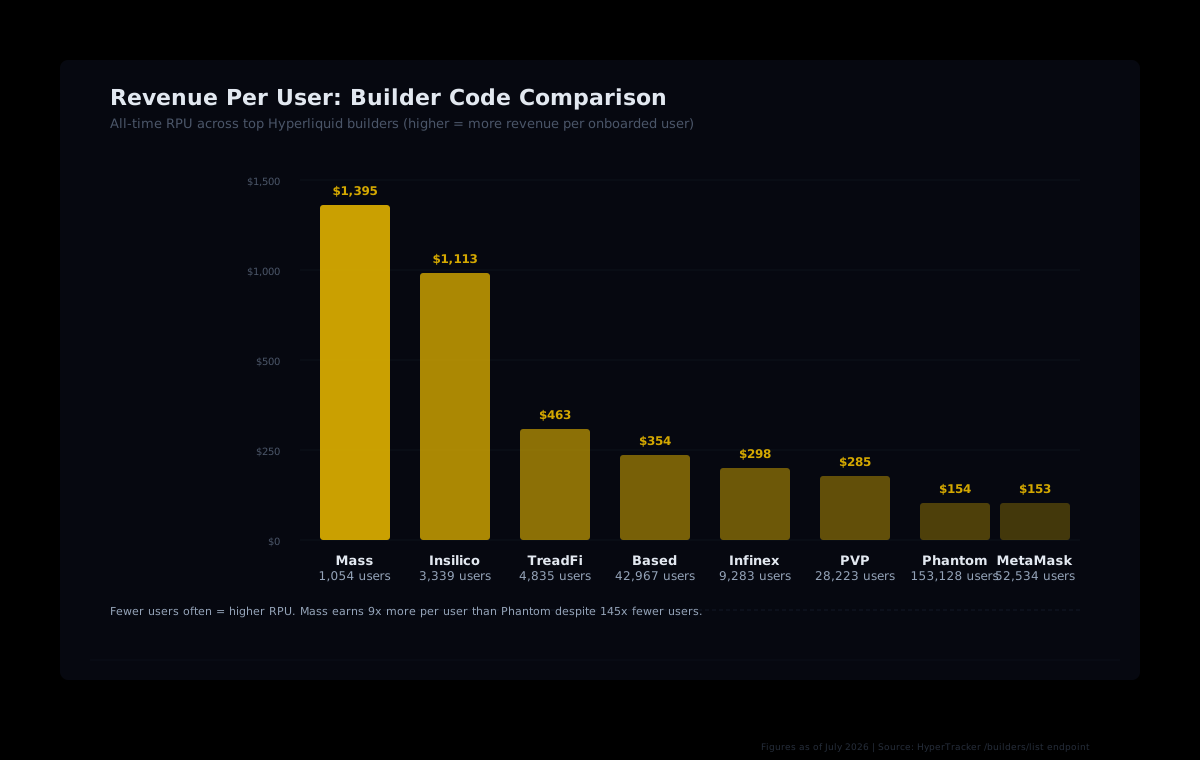
Phantom has earned $23.6 million in Hyperliquid builder code revenue. Mass has earned $1.5 million. On a raw leaderboard, Phantom looks like it's winning by a factor of 16. But divide by users and the picture flips: Mass earns $1,395 per user while Phantom earns $154.
Figures as of July 2026, from HyperTracker's builder leaderboard.
Revenue per user (RPU) is the metric that separates builders running sustainable businesses from those coasting on distribution. Total revenue rewards scale. RPU rewards depth, because it measures how much value each user generates for the builder. That distinction matters more as the builder ecosystem matures and the easy distribution wins get claimed.
This article breaks down RPU across Hyperliquid's top builders, explains why the numbers diverge so dramatically, and shows how to query this data yourself through our API.
The RPU Leaderboard Looks Nothing Like the Revenue Leaderboard
When you sort builders by total revenue, wallets dominate. Phantom sits at #1 with $23.6 million, followed by Based at $15.2 million and MetaMask at $8.1 million. These are products with massive existing user bases that bolted on Hyperliquid support.
Sort by RPU and the order reshuffles completely.
| Builder | Revenue | Users | RPU | Volume/User | | --- | --- | --- | --- | --- | | Mass | $1.47M | 1,054 | $1,395 | $2.42M | | Insilico | $3.72M | 3,339 | $1,113 | $10.87M | | TreadFi | $2.24M | 4,835 | $463 | $2.30M | | Based | $15.22M | 42,967 | $354 | $1.05M | | Infinex | $2.77M | 9,283 | $298 | $556K | | PVP | $8.03M | 28,223 | $285 | $607K | | Dreamcash | $1.84M | 11,215 | $164 | $677K | | Phantom | $23.61M | 153,128 | $154 | $293K | | MetaMask | $8.06M | 52,534 | $153 | $172K | | Liquid | $1.52M | 9,499 | $160 | $338K |
Mass earns 9x more per user than Phantom. Insilico earns 7x more. Both sit well below Phantom on the total revenue leaderboard, but the users they attract trade heavier and generate more fee revenue per person. That's a fundamentally different business from acquiring millions of casual users.
Why RPU Diverges: Three Patterns
The spread between $1,395/user and $154/user isn't random. It maps to distinct product strategies, each with different implications for sustainability.
Niche products attract heavy traders
Insilico serves 3,339 users but those users have generated $36.3 billion in volume. That's $10.87 million in volume per user, the highest of any top-10 builder. Insilico's product is built for quants and algorithmic traders who trade frequently and size positions aggressively. Every user matters because every user trades a lot.
Mass shows a similar pattern: 1,054 users, $2.5 billion in volume, and $1,395 in RPU. Small user base, each user contributing meaningful volume.
Distribution plays dilute RPU
Phantom and MetaMask are the opposite archetype. Both are wallets with massive pre-existing user bases. When they added Hyperliquid support, they onboarded tens of thousands of users quickly, but many of those users are casual traders. They might open one position, try it out, and never come back. That dilutes the RPU calculation because the denominator (users) grows faster than the numerator (revenue).
Phantom's 153,128 users include everyone from active day traders to users who tried a single trade. The 153K number represents total unique wallet addresses that have ever traded through Phantom's builder code, which means one-time visitors pull the average down.
Social trading creates a middle tier
Based sits at $354/user with 42,967 users, occupying an interesting middle ground. As a social trading platform, Based attracts users who actively follow and copy other traders, which means higher engagement than a passive wallet but lower intensity than a quant terminal. Copy-trading users tend to stay active longer because they're following positions in real time, which pushes RPU above the wallet baseline.
Volume Per User: The RPU Driver
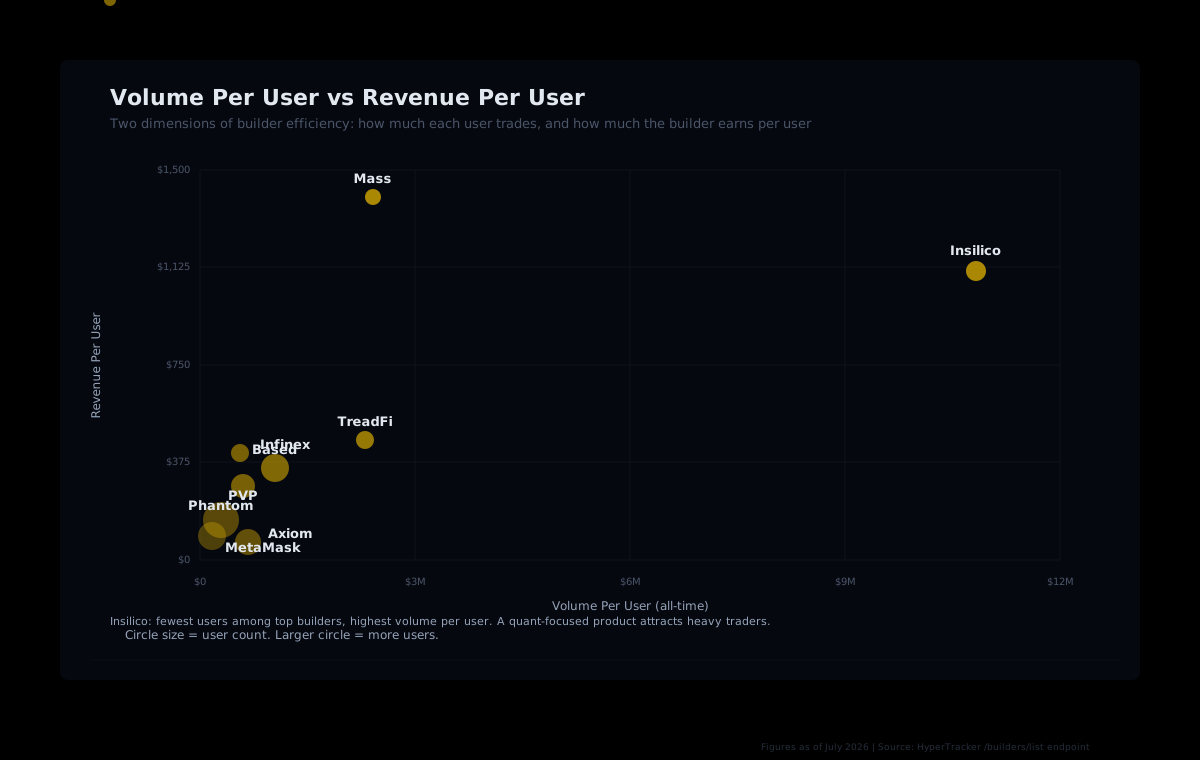
RPU is a function of two things: how much each user trades (volume per user) and what fee rate the builder charges. Since most builders operate within a similar fee range, volume per user is the primary differentiator.
Insilico's $10.87 million in volume per user dwarfs the rest of the leaderboard. The next highest is Mass at $2.42 million per user. Phantom's users average $293K each, and MetaMask's average $172K.
This 37x gap in volume per user (Insilico vs. MetaMask) tells you these products serve completely different audiences. Insilico's users are sophisticated traders running systematic strategies. MetaMask's users are crypto-native wallets that happen to offer perps. Both are valid business models, but the economics scale differently.
Key insight: A builder with 1,000 heavy traders can generate more fee revenue than a builder with 50,000 casual users. RPU captures this distinction in a single number.
The Builder Strategy Quadrant
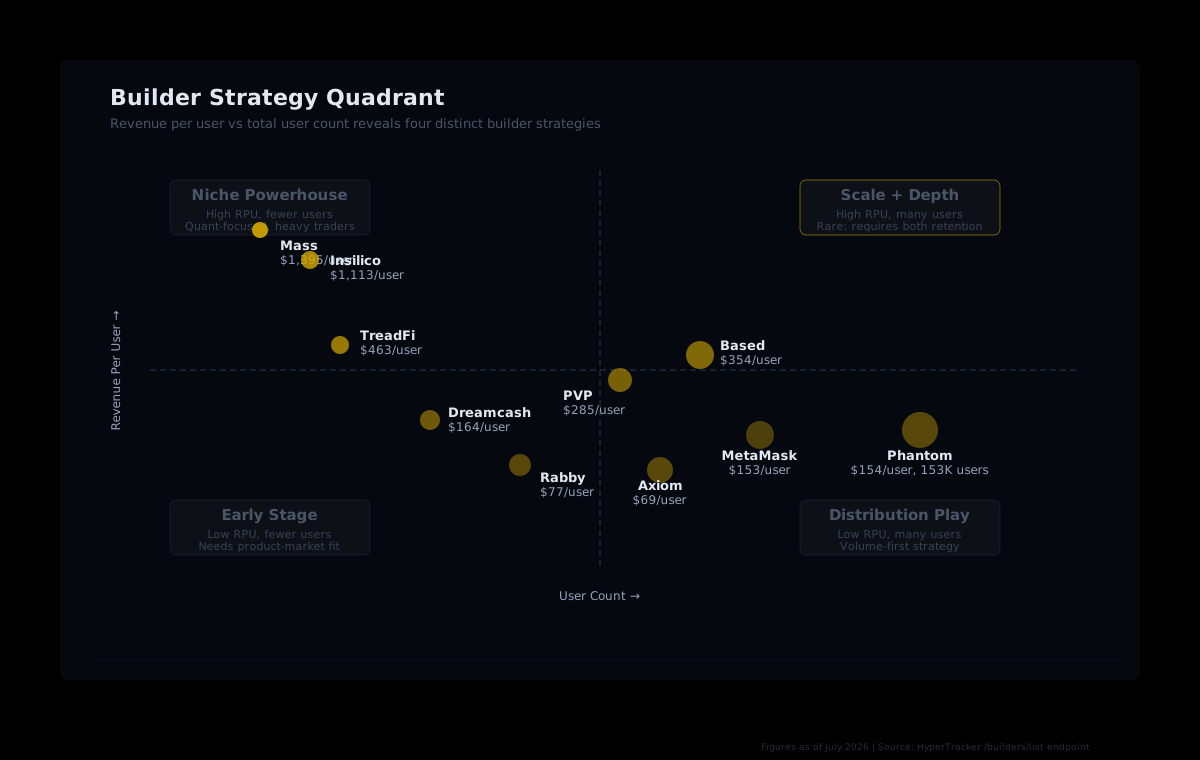
Plotting RPU against user count reveals four quadrants that map to distinct builder strategies.
Niche Powerhouse (high RPU, fewer users): Mass, Insilico, TreadFi. These builders have carved out a specific user segment and serve it deeply. Their risk is user concentration: losing a handful of whale traders meaningfully impacts revenue. Their advantage is that each new user acquisition has high expected value.
Distribution Play (low RPU, many users): Phantom, MetaMask, Rabby. These builders monetize an existing install base. Their risk is low retention, since users who tried perps once but never returned still count in the denominator. Their advantage is that even at $154/user, 153K users produces $23.6 million in total revenue.
Scale + Depth (high RPU, many users): This quadrant is mostly empty, and for good reason. Maintaining high RPU while scaling to tens of thousands of users requires both a compelling product and a user base that stays engaged over time. Based, at $354/user with 43K users, is the closest to this zone.
Early Stage (low RPU, fewer users): Many newer builders fall here. Low user counts and low per-user revenue. The path forward is either deeper product (raise RPU) or broader distribution (raise user count), but trying both simultaneously usually means doing neither well.
What RPU Tells You About Builder Sustainability
Total revenue is a vanity metric when comparing builders. A builder earning $8 million from 28,000 users (PVP at $285/user) has a more defensible position than one earning the same from 100,000 users at $80/user, because PVP's users are individually more valuable and harder for competitors to poach.
High-RPU builders tend to have stronger retention. Their users chose the product for a reason: better order types, faster execution, specialized analytics, or automated strategy support. These are switching costs. A casual Phantom user might try a different wallet tomorrow. An Insilico user running live quant strategies has integration costs that make switching expensive.
RPU also signals pricing power. Builders whose users trade heavily can afford to charge lower fee rates and still earn substantial revenue per user, or they can charge standard rates and earn outsized returns. That flexibility matters when competing for user flow in a market where fee pressure tends to compress over time.
How to Query Builder RPU Through Our API
Our builder analytics endpoints expose the raw numbers behind these calculations. A single call to /builders/list returns revenue, user count, and volume per builder code. From there, computing RPU is straightforward division.
You can filter by timeframe (daily, weekly, monthly, all-time) to track how RPU trends over time. A builder whose all-time RPU is $300 but whose monthly RPU is dropping to $150 might be acquiring lower-quality users. One whose monthly RPU is rising is either retaining heavy traders better or attracting a higher-quality user base.
Combining builder data with our 16 behavioral cohorts (eight by wallet size, eight by all-time PnL) gives you a richer picture. Which builder codes attract Money Printer wallets (those with over $1M in all-time gains)? Which ones skew toward Shrimp ($0-$250 in perp equity)? The cohort composition of a builder's user base explains its RPU far better than aggregate numbers alone.
Builder + cohort analysis: Query
/builders/listfor RPU, then cross-reference with/cohort/metricsto understand which trader segments drive each builder's revenue. Our data refreshes every 5 minutes, so you can track shifts in real time.
Track Builder Code RPU with Our API
Builder analytics, 16 behavioral cohorts, and volume attribution. One API call to get the numbers behind every builder code on Hyperliquid.
The RPU Benchmark Going Forward
Hyperliquid's builder ecosystem has paid out over $90 million in all-time builder code revenue across 1,411 builders. Those builders have routed $274.9 billion in volume.
As HIP-3 assets (equities, commodities, forex) bring new asset classes to Hyperliquid and HIP-4 adds prediction markets, the builder code total addressable market keeps expanding. But RPU will separate the builders who capture durable revenue from those who ride temporary traffic spikes.
The leaderboard rewards total volume. RPU rewards something harder to build: a product that makes each user trade more, trade bigger, and keep coming back. Mass's 1,054 users generate more revenue per head than Phantom's 153,128. That's the number worth watching.