
Stablecoins Are Flooding Perp DEXes. Here's Where the Liquidity Lands
By CMM Team - 05-Aug-2026
Stablecoins Are Flooding Perp DEXes. Here's Where the Liquidity Lands
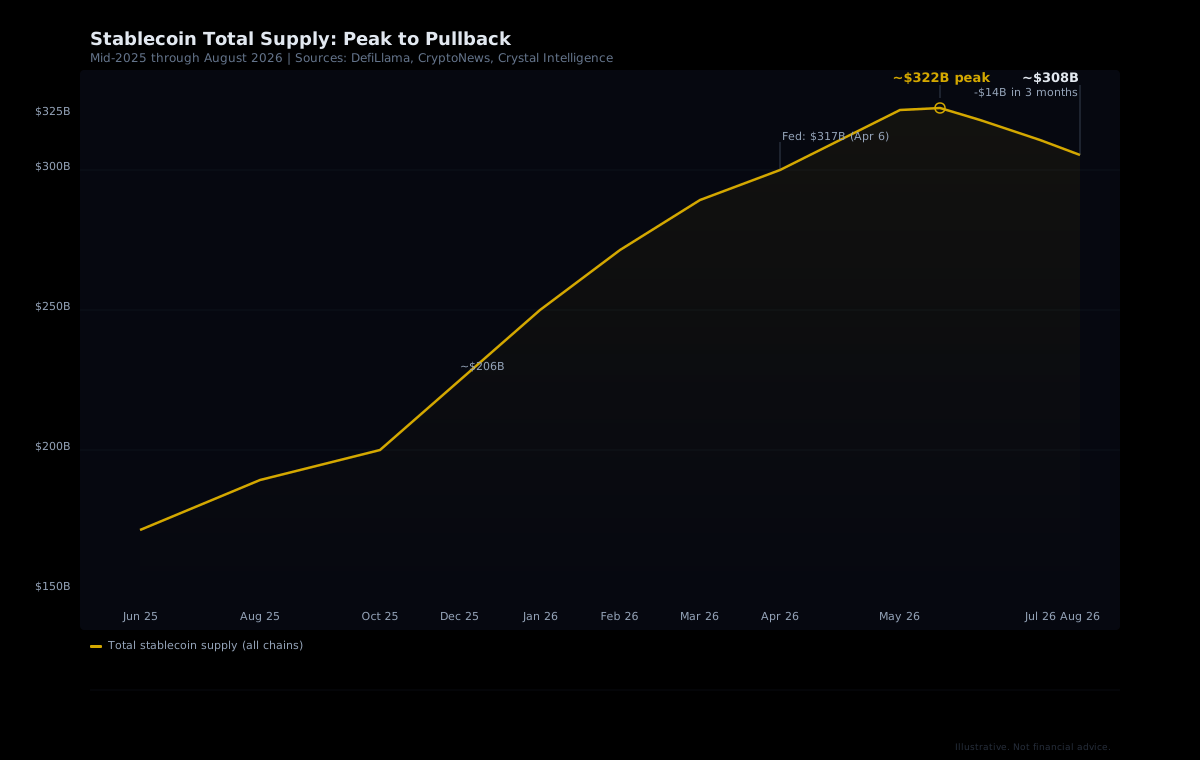
Total stablecoin supply peaked near $322 billion in mid-May 2026 and then started bleeding. By early August, roughly $14 billion had left, the steepest contraction since TerraUSD collapsed in 2022. June alone erased approximately $11 billion from the sector's capitalization.
But here's the part most market commentary misses: not all stablecoins go to the same places, and the ones that flow into perpetual futures margin behave very differently from the ones sitting in wallets or earning yield. On Hyperliquid, roughly $5 billion in USDC sits as margin collateral right now. That collateral fuels every leveraged position on the exchange, which means stablecoin supply shifts do not just affect passive holders. They reshape the liquidity environment for every trader on the platform.
Understanding where that margin concentrates, and which types of traders are adding or withdrawing collateral, turns a macro stablecoin headline into an actionable trading signal.
The $14 Billion Drawdown, in Context
The stablecoin market grew almost twelvefold in five and a half years, from about $27 billion at the end of 2020 to roughly $316 billion by June 2026. Supply shrank in both 2022 and 2023 before two record expansion years in 2024 and 2025. The recent pullback breaks that momentum for the first time since the Terra episode.
The Federal Reserve's April 2026 analysis pegged aggregate stablecoin market capitalization at $317 billion, representing more than 50% growth since early 2025. So even after the drawdown, supply remains well above year-ago levels. The contraction is real, but it's a pullback from an all-time high rather than a structural unwind.
What caused it? Several forces converged. The GENIUS Act's yield restrictions barred licensed stablecoin issuers from paying interest on holdings, which pushed capital toward tokenized Treasury products and money-market funds. Broader crypto market weakness reduced demand for trading collateral. And European regulations under MiCA restricted certain non-compliant tokens on exchanges, creating additional outflow pressure.
USDT and USDC: Where the Weight Sits
Two stablecoins dominate the market so thoroughly that their individual movements define the sector's trajectory. Tether's USDT fell from roughly $189 billion in early May to about $183 billion by August. Circle's USDC dropped from a March peak near $80 billion to around $72 billion over the same stretch. Together, they control about 83% of all stablecoin supply.
This concentration matters enormously for perp DEXes because USDC is the primary margin asset on most decentralized perpetual platforms, Hyperliquid included. When USDC supply contracts, the margin pool that underpins leveraged trading tightens directly. A $5.8 billion decline in USDC over the past 90 days is not an abstraction. It's real collateral exiting the system.
Why USDC Contraction Hits Perp DEXes Harder
USDT skews toward emerging-market and offshore demand, heavily concentrated on Tron. USDC is the default inside regulated US and European fintech stacks, and it's the settlement asset on Hyperliquid. When USDC contracts, the margining capacity for on-chain derivatives contracts directly.
Despite the supply drop, adjusted on-chain transaction volume reached about $1.8 trillion in June 2026, up roughly 63% from the previous month. So usage velocity is rising even as supply falls, which points to the remaining stablecoins being deployed more actively rather than sitting idle. For perp DEX margin, this means higher capital efficiency: fewer total stablecoins, but the ones still on-platform are working harder.
$5 Billion in Margin: Where It Concentrates
Hyperliquid holds roughly $5 billion in USDC as margin collateral. That margin is not distributed evenly across traders. It concentrates heavily in larger accounts, which means a relatively small number of wallets control the liquidity environment for the entire exchange.
Our data classifies every Hyperliquid wallet into 16 behavioral cohorts, eight by perp equity (account size) and eight by all-time PnL. On the size axis, cohorts range from Shrimp ($0-$250) through Fish, Dolphin, Apex Predator, Small Whale, Whale, Tidal Whale, and Leviathan ($5M+). On the PnL axis, they range from Money Printer (+$1M+) through Smart Money, Consistent Grinder, Humble Earner, Exit Liquidity, Semi-Rekt, Full Rekt, and Giga-Rekt (below -$1M).
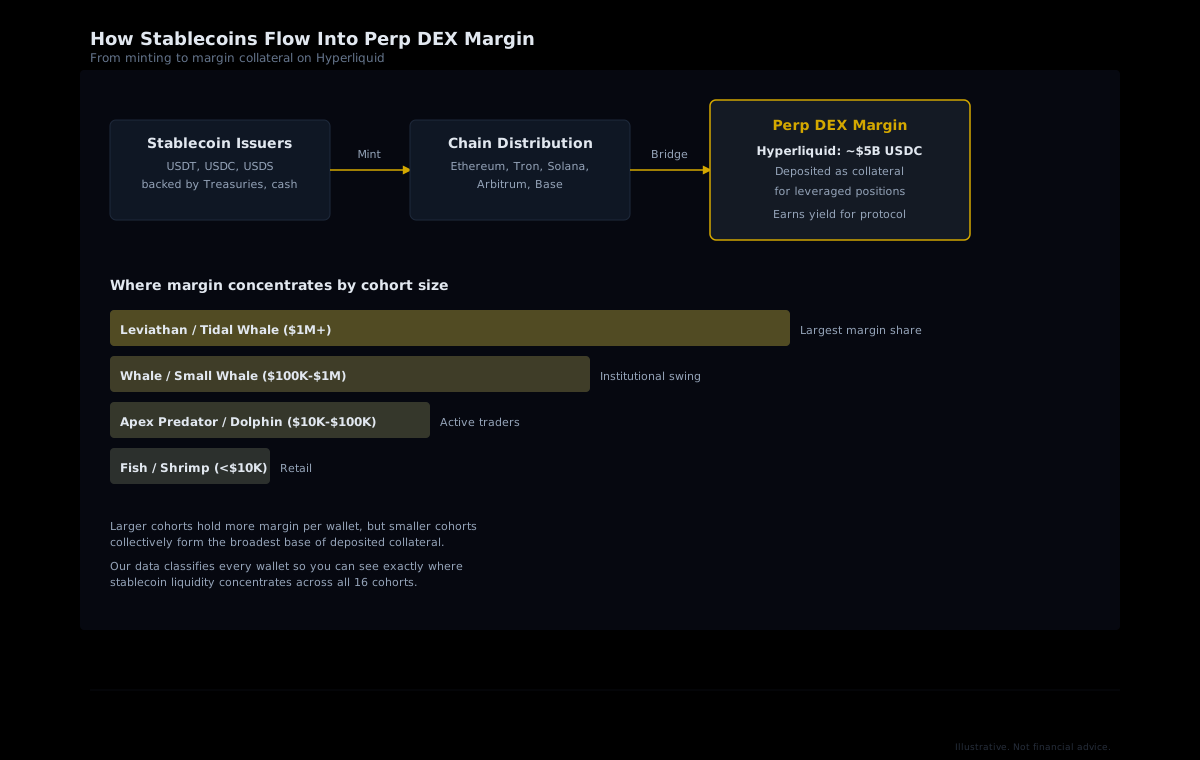
Leviathan and Tidal Whale accounts hold far more margin per wallet than any other segment. But Fish and Shrimp cohorts, while holding less individually, form the broadest base of deposited collateral by sheer numbers. When stablecoin supply contracts, the question that matters is: which cohorts are pulling margin, and which are adding?
Reading Liquidity Shifts Through Cohort Behavior
Aggregate stablecoin supply numbers tell you that $14 billion left. They do not tell you who withdrew, whether it was retail or institutional, and whether the remaining capital is being used more aggressively or more defensively. Cohort-level analytics fill those gaps.
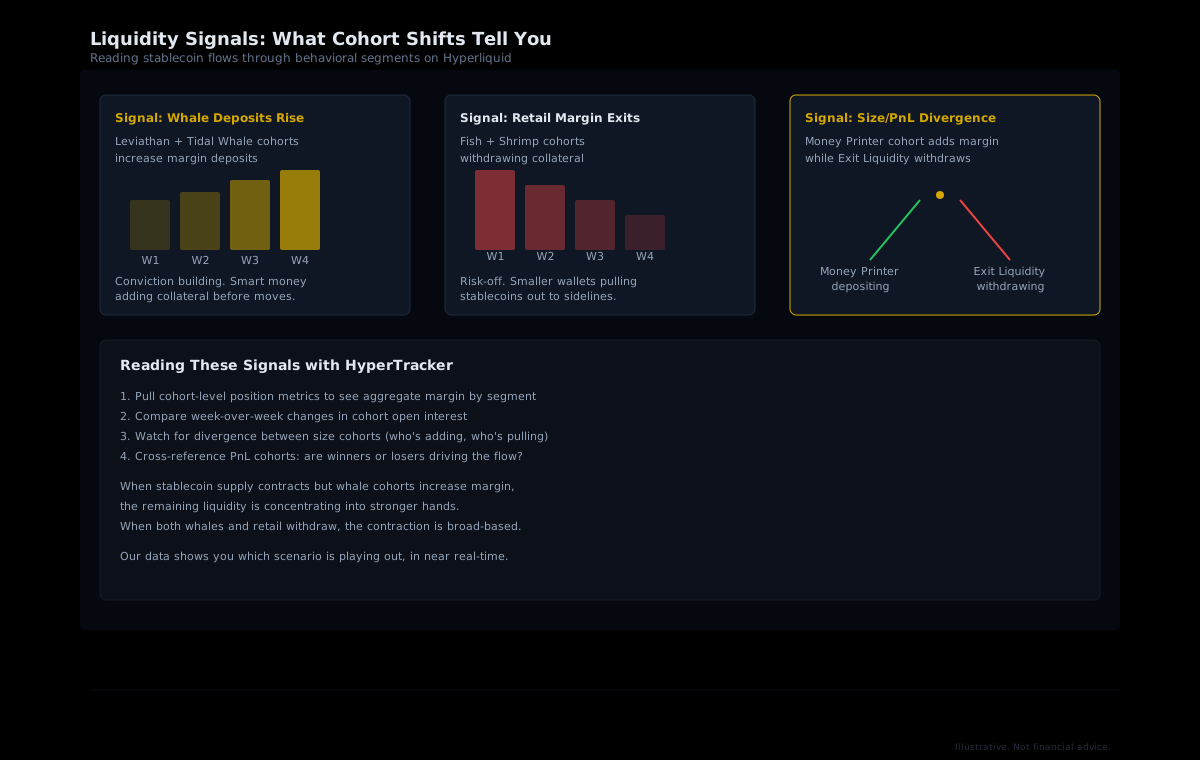
Signal 1: Whale Margin Deposits Rising
When Leviathan and Tidal Whale cohorts increase their margin deposits while smaller cohorts stay flat or decline, it signals conviction among the best-capitalized traders. These wallets are not adding collateral because the market looks safe. They are positioning for moves they expect to capitalize on. Historically, rising whale margin during broad stablecoin contraction has preceded periods of elevated volatility, because concentrated liquidity amplifies the impact of large positions.
Signal 2: Retail Margin Exits
If Fish and Shrimp cohorts withdraw collateral during a stablecoin drawdown, it typically reflects risk-off sentiment at the retail level. These are the wallets that respond most quickly to price declines and macro fear. A sustained retail margin exit while whale deposits hold steady creates a divergence that experienced traders watch closely, because it means the liquidity profile is shifting from broad to concentrated.
Signal 3: PnL Cohort Divergence
The most actionable signal comes from crossing size and PnL cohorts. When Money Printer wallets (the consistently profitable) are adding margin while Exit Liquidity wallets (the consistently losing) are withdrawing, the market's capital is migrating toward stronger hands. When both groups pull collateral simultaneously, the contraction is broad-based and typically precedes lower-volatility, lower-volume periods.
Hyperliquid's Position in the Perp DEX Landscape
Hyperliquid processed $172.6 billion of $540.8 billion in total 30-day perpetual DEX volume as of the latest data, representing about 32% of tracked activity. Open interest sits near $9.2 billion, and the protocol has accumulated $4.4 trillion in cumulative all-time volume. The platform has attracted 1.4 million total users.
The competition has intensified significantly. In May 2025, Hyperliquid held about 71% of on-chain perpetual volume. By April 2026, that share had compressed to roughly a third as Aster and Lighter gained traction. But Hyperliquid's share of open interest remains materially higher than its headline volume share, which means the traders on Hyperliquid hold positions longer and deploy more margin per trade than the competition's user base.
For stablecoin liquidity analysis, this distinction matters. A platform where $5 billion in USDC sits as margin and open interest exceeds $9 billion is not just a trading venue. It's a liquidity sponge that absorbs and deploys stablecoins at a scale that makes its cohort-level dynamics a proxy for broader market sentiment.
Turning Stablecoin Flows Into Trading Intelligence
Macro stablecoin data tells you the weather. Cohort-level perp DEX data tells you which boats are raising their sails and which are heading for harbor. The practical application breaks down into three layers:
Layer 1: Monitor aggregate stablecoin supply. Track total supply, USDT/USDC individually, and watch for sustained multi-week trends rather than daily noise. The current drawdown became significant when June posted its $11 billion single-month drop, because it broke the expansion pattern that had held since 2024.
Layer 2: Map where stablecoins concentrate on-chain. Not all stablecoin movement is created equal. Capital flowing into perp DEX margin has a direct multiplier effect on leverage and liquidity. Capital flowing out reduces the margin pool and can trigger deleveraging cascades when positions are liquidated against a shallower collateral base.
Layer 3: Use cohort analytics to read who is moving. This is where generic stablecoin dashboards stop and purpose-built intelligence begins. Our data lets you pull cohort-level positioning, segment-level bias, and aggregate margin distribution across all 16 behavioral segments. Instead of knowing that "$14 billion left stablecoins," you can see whether that contraction is driven by whales de-risking, retail capitulating, or a mix of both.
See Where Stablecoin Liquidity Concentrates
HyperTracker's API classifies every Hyperliquid wallet into 16 behavioral cohorts by size and PnL. Pull cohort-level positioning, margin distribution, and bias data with a single API call. Starts at $179/mo for 50K requests.
What the Current Drawdown Tells Us
The $14 billion contraction in stablecoin supply is not a liquidity crisis. It's a repricing of where capital wants to sit. Yield-bearing tokenized Treasuries are pulling conservative capital away from non-interest-bearing stablecoins. Regulatory pressure in Europe and the post-GENIUS Act landscape is forcing issuers to choose between compliance costs and market share. And the broader crypto market drawdown reduced the speculative demand that inflates stablecoin minting during bull runs.
But on perp DEXes, the USDC that remains is doing more work than ever. Hyperliquid's $5 billion margin pool supports $9.2 billion in open interest, which implies roughly 1.8x capital efficiency across the platform's aggregate positions. As stablecoin supply tightens, that ratio becomes the pressure gauge. If open interest rises while margin stays flat, leverage is increasing. If margin falls while open interest holds, the platform is running on thinner collateral.
Cohort analytics turn this from a dashboard metric into a tradeable framework. When you can see that Leviathan wallets are increasing their margin while Shrimp wallets pull out, you are watching institutional conviction diverge from retail fear in real time. That divergence has historically preceded the kind of sharp, directional moves that define perp trading edge.
The stablecoins did not disappear. They just moved. The question is whether you can see where they went. With 16 behavioral cohorts, refreshing every few minutes, covering every wallet on Hyperliquid, our data shows you exactly that.