
Stop Copy Trading Whales. Follow Winners Instead.
By CMM Team - 29-Jul-2026
Stop Copy Trading Whales. Follow Winners Instead.
Every copy trading dashboard on Hyperliquid starts the same way: sort by account size, find the biggest wallet, and mirror its trades. The logic feels sound. Big wallet, big brain, right?
Not really. A wallet holding $3 million in perp equity might be a fund that has been bleeding money for six months straight. Another wallet with $40,000 might have turned $2,000 into that balance through consistently profitable trades over the same period. If you picked your copy target by size alone, you followed the loser. The winner flew under your radar because their balance looked small.
This is the core problem with size-based wallet filtering for copy trading: it measures capital, which says nothing about skill. Hyperliquid's on-chain transparency makes it possible to do better, because every wallet's entire trade history and cumulative profit or loss is publicly verifiable. The question is whether you use that data or ignore it.
The Whale Fallacy
Crypto Twitter loves whale watching. Tracking large wallets feels like following institutional flow, and sometimes it is. But on a perps-native chain like Hyperliquid, wallet size and trading profitability are separate dimensions entirely.
A wallet can be large for reasons that have nothing to do with trading skill. It might be a market maker whose PnL comes from spread capture, not directional bets. It could be a fund that deposited venture capital and has been slowly losing it on poorly timed trades. Or it could be a genuinely skilled trader who happens to also have deep pockets. You cannot tell the difference by looking at the balance alone.
Research backs this up. In a 90-day study covering more than 100,000 copier outcomes across three exchanges, 97% of copy-trade leaders were profitable on their own books, but only about 44% of them produced positive PnL for the people copying them. That is a 53-point gap between leader performance and copier outcomes, and it gets wider when copiers filter by size instead of track record.
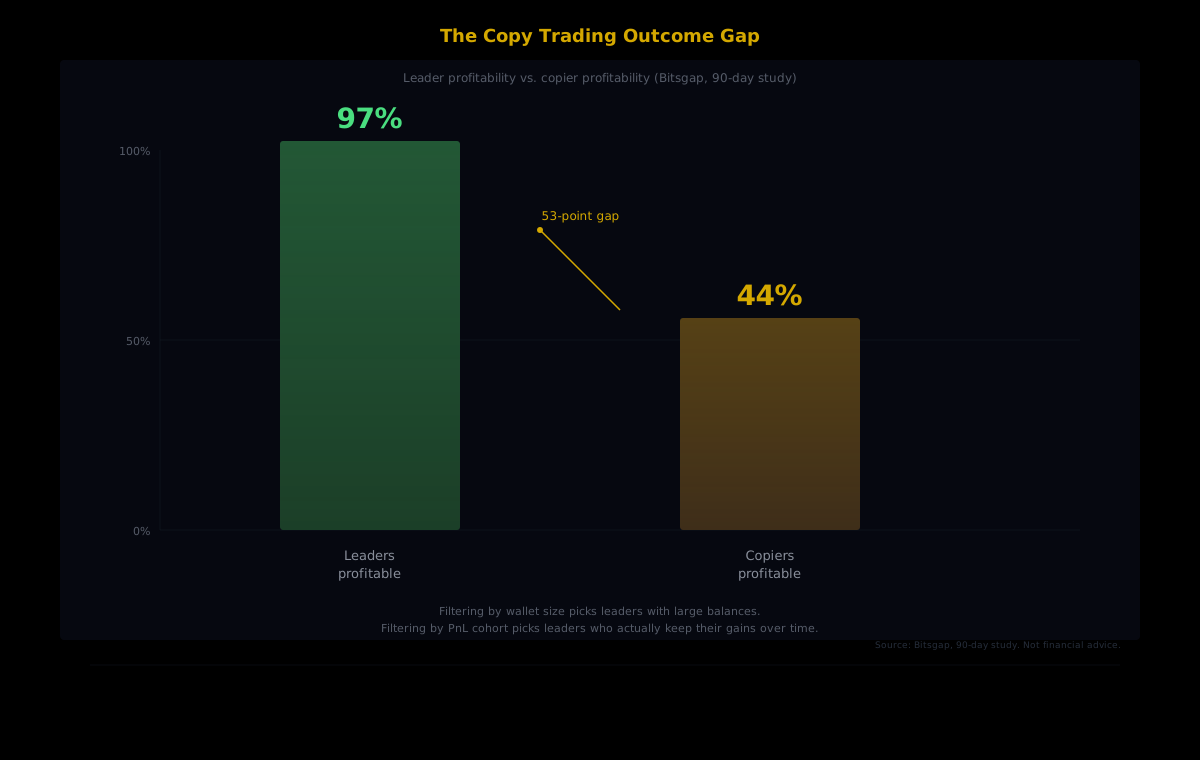
The reasons are well understood. Copied trades suffer from execution lag, where your fill lands at a different price than the leader's because the market has already moved. Slippage compounds this, especially on thinner books or during volatile conditions. And the leader's position sizing makes sense for their account, but the proportional sizing on your smaller account creates a different risk profile entirely.
Size Cohorts vs. PnL Cohorts
HyperTracker classifies every Hyperliquid wallet into 16 behavioral cohorts. Eight are based on perp equity (size), and eight are based on all-time cumulative profit and loss (PnL). These are two completely different lenses on the same set of wallets, and the distinction matters enormously for copy trading.
The size cohorts run from Shrimp ($0 to $250 in perp equity) up through Fish, Dolphin, Apex Predator, Small Whale, Whale, Tidal Whale, and Leviathan ($5M+). They tell you how much capital a wallet controls. Useful for gauging market impact, but silent on whether that capital is growing or shrinking.
The PnL cohorts tell a different story. They range from Money Printer (more than $1M in cumulative all-time profit) and Smart Money ($100K to $1M profit) at the top, through Consistent Grinder and Humble Earner in the middle, down to Exit Liquidity, Semi-Rekt, Full Rekt, and Giga-Rekt (more than $1M in cumulative losses) at the bottom.
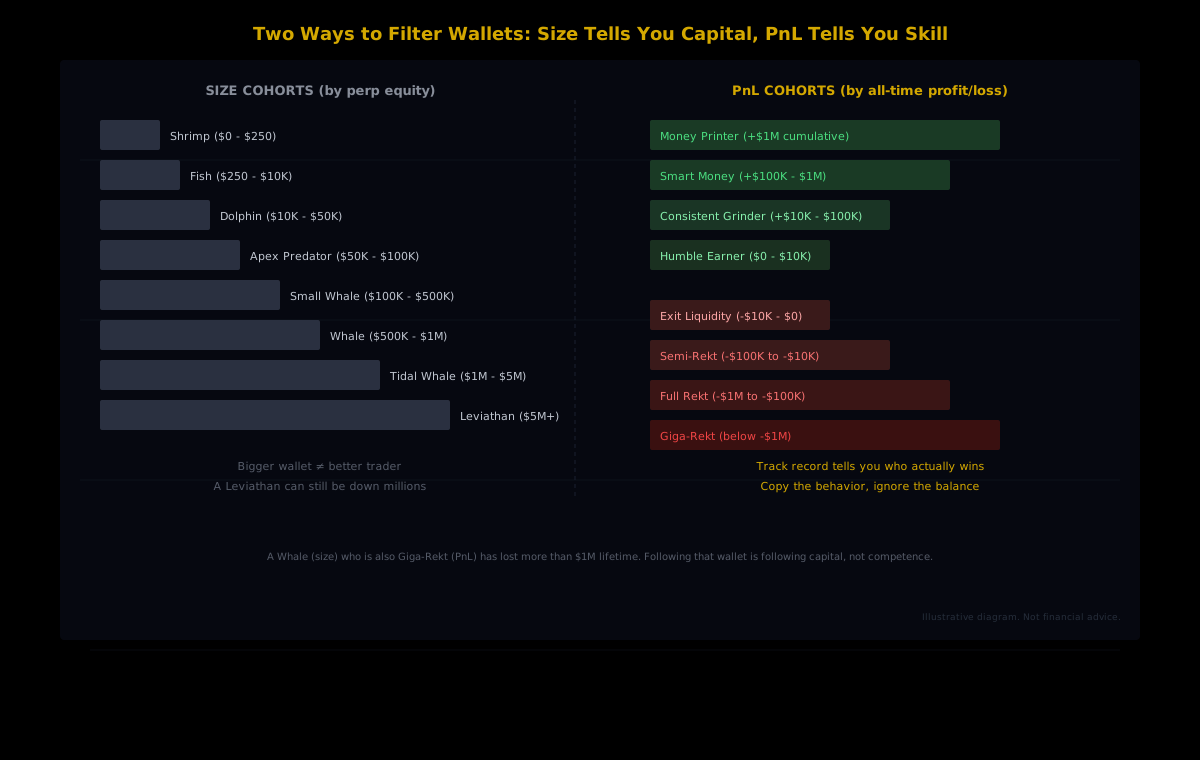
Here is the key insight: a wallet can be a Whale by size and Giga-Rekt by PnL simultaneously. That wallet has more than $500K in perp equity and has lost more than $1M over its lifetime. Copying that wallet because it is a "whale" means copying a trader who has consistently lost money despite having a large balance.
Conversely, a Dolphin-sized wallet ($10K to $50K) that sits in the Money Printer cohort has turned a small stake into substantial cumulative profit. That track record, built over months of on-chain verifiable trades, is a far more meaningful signal than account balance.
Why Consensus Beats Individual Signals
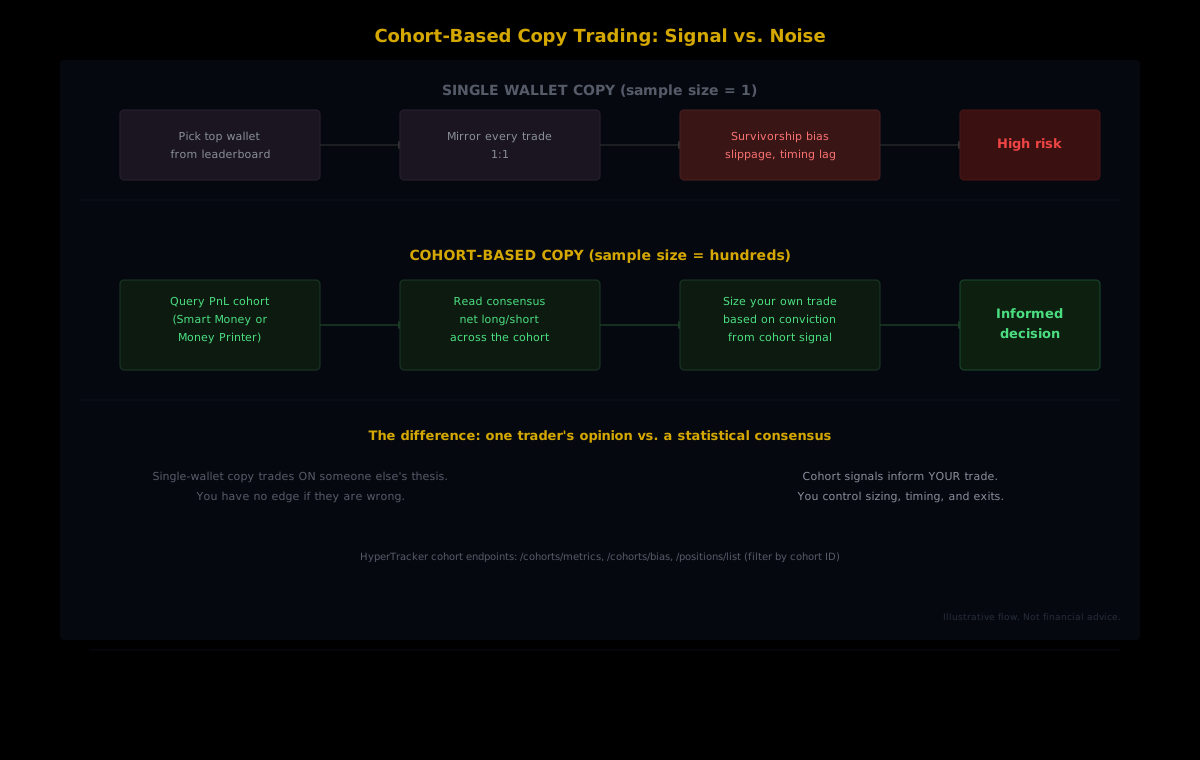
Even after you switch from size-based to PnL-based filtering, copying a single wallet is still a sample size of one. One trader can have a hot streak, get overconfident, and blow up. One wallet can change hands. One strategy can stop working when market conditions shift.
Cohort-level signals solve this by aggregating behavior across hundreds of wallets that share the same profitability profile. When the entire Smart Money cohort (wallets with $100K to $1M in all-time profit) shifts net long on ETH, that is not one trader's opinion. It is a consensus signal from a statistically meaningful group of proven winners.
Single-wallet copy: you trade on someone else's thesis. If they are wrong, you are wrong.
Cohort signal: you read the collective positioning of proven traders and make your own decision about sizing and timing.
The practical difference is control. When you copy a wallet directly, you inherit their entries, their exits, their sizing, and their mistakes. When you use cohort positioning as a signal, you decide how much to allocate, when to enter, and where to set your stops. The cohort data informs your trade rather than replacing your judgment.
Reading Cohort Bias in Practice
HyperTracker's cohort bias endpoint returns the net long/short positioning for any cohort on any asset. This is the raw signal that replaces single-wallet copy trading.
Imagine you want to know what proven traders think about BTC right now. Instead of finding one profitable wallet and copying their position, you query the Smart Money cohort's bias on BTC. If the cohort is collectively net long with increasing position sizes, that is a directional consensus. If they are reducing exposure while retail-heavy cohorts like Exit Liquidity are adding long positions, that divergence is itself a signal worth paying attention to.
The API call is straightforward:
GET /api/external/cohorts/bias?cohortId=9&coin=BTC
That returns the Smart Money cohort's (ID 9) current bias on BTC, including net positioning and directional lean. You can compare it against other cohorts to read divergences. For example, querying the Exit Liquidity cohort (ID 12) on the same asset and comparing the two gives you a smart-money-vs-retail spread that single-wallet tracking cannot provide.
Cross-Cohort Divergence
The most interesting signals come from disagreements between cohorts. When Money Printer and Smart Money wallets are both going long while Semi-Rekt and Full Rekt wallets are going short, the historically profitable traders are on one side and the historically unprofitable traders are on the other. That is not a guarantee of direction, but it is a much richer dataset than watching one whale's positions change.
You can also track how cohort positioning evolves over time using the cohort metrics endpoint. If Smart Money wallets have been steadily increasing their BTC allocation over the past week while reducing altcoin exposure, that trend tells you something about conviction that a single wallet snapshot cannot capture.
Position Sizing with Cohort Context
One of the biggest mistakes in copy trading is mirroring position sizes without adjusting for your own account. A Money Printer wallet might run a position that represents a small fraction of their equity, but the same dollar amount on your smaller account could mean catastrophic leverage.
Cohort data gives you a different approach to sizing. Instead of copying absolute position sizes, you use cohort consensus strength as a confidence input for your own position sizing framework.
Imagine one possible interpretation: when Money Printer and Smart Money cohorts are both aligned in the same direction on an asset, a trader might treat that strong consensus as justification for a larger allocation from their risk budget. When only one cohort is leaning directional while the other is flat or mixed, they might reduce their position sizing. This is one illustrative approach among many. Your position sizing framework is your own, and the cohort signal informs it rather than replacing it.
Key distinction: HyperTracker classifies wallets into cohorts based on verifiable on-chain performance. The sizing decisions you make using our data are yours. Our data shows you who is winning and how they are positioned. Your risk management framework determines what you do with that information.
What Makes Hyperliquid Different for This Approach
This kind of behavioral analysis works specifically because Hyperliquid runs an on-chain order book. Every position, entry, exit, and PnL outcome is recorded on the L1 and publicly verifiable. Nobody can fake a track record, because the ledger does not lie.
On centralized exchanges, you rely on self-reported performance or platform-curated leaderboards that can be gamed through selective display, contest accounts, or deposit-inflated PnL percentages. Hyperliquid strips away that ambiguity. A wallet in the Money Printer cohort has verifiably earned more than $1M in cumulative profit across its entire trading history on the chain. That is not a claim on a leaderboard. It is a mathematical fact derived from on-chain data.
This transparency also means the cohort classifications update as wallets' performance changes. A Consistent Grinder who strings together a series of profitable months will eventually graduate to Smart Money. A Smart Money wallet that has a catastrophic drawdown will reclassify downward. The cohorts are dynamic, which means the signals they produce reflect current reality rather than historical snapshots.
Build the Signal Layer
If you are building a copy trading system or a signal bot on Hyperliquid, here is the practical shift: stop querying individual wallet positions and start querying cohort-level metrics. The relevant HyperTracker endpoints are:
/cohorts/metricsfor aggregate positioning data per cohort per asset/cohorts/biasfor net directional lean (long vs. short) by cohort/positions/listfiltered by cohort ID to see individual positions within a segment/leaderboardsfor top performers ranked by PnL across different time windows
The leaderboard endpoint is useful as a starting point, but notice the difference: instead of copying the top wallet directly, you use the leaderboard to identify which PnL cohorts are active and then read the cohort's collective positioning. The leaderboard shows individuals. The cohort endpoints show consensus.
For builders shipping copy trading tools, the cohort-based approach also simplifies your architecture. You do not need to maintain a watchlist of individual wallets, handle edge cases when a wallet goes dormant, or worry about one wallet's strategy shift breaking your entire system. The cohort is the signal source, and it is inherently diversified.
Query Cohort Signals with HyperTracker
Our API classifies every Hyperliquid wallet into 16 behavioral cohorts by size and all-time PnL. Query cohort-level positioning, bias, and metrics starting at $179/mo. The free tier gives you 100 requests per day to test the endpoints.
The Bottom Line
Wallet size tells you who has capital. Wallet behavior, measured by cumulative PnL across an entire trading history, tells you who knows how to keep it. Copy trading systems that filter by balance are optimizing for the wrong variable, and the 53-point gap between leader profitability and copier profitability shows why.
Cohort-level signals go further by replacing single-wallet dependence with statistical consensus. You stop betting on one trader's next move and start reading how an entire class of proven winners is positioning. That is a fundamentally different kind of edge, and it is the one Hyperliquid's on-chain transparency makes possible.
Stop following the biggest wallet in the room. Follow the ones that keep winning.