
The $4.5B Short Squeeze: What Hyperliquid Whales Knew First
By CMM Team - 26-Aug-2026
The $4.5B Short Squeeze: What Hyperliquid Whales Knew First
Bitcoin moved from $64,530 to $79,603 in 45 hours. Over $4.5 billion in short positions were liquidated across the week, including the largest single-day liquidation event in records going back to 2021. Shorts made up more than 90% of all liquidations during the move.
But the more interesting story wasn't the squeeze itself. It was who saw it coming. On-chain positioning data from Hyperliquid showed that the largest and most profitable trader cohorts had been quietly building long exposure for weeks before the catalyst landed. Smaller, historically unprofitable cohorts crowded the short side and became the liquidation fuel.
This is the anatomy of a short squeeze that was readable in advance, and a case study in why behavioral cohort analysis matters more than following individual whale wallets.
The Setup: Six Weeks of Compression
Bitcoin spent most of July and early August boxed between roughly $62,000 and $66,900. Thirty-day realized volatility compressed to 27.2% against a long-run average near 80%. That kind of compression is a coiled spring. The question was always direction, not magnitude.
Positioning got heavily one-sided. Every approach to the ceiling attracted more sellers. The Crypto Fear and Greed Index sat at 30 on August 17, deep in fear territory. Retail sentiment was defensive, and leveraged shorts were piling in on the assumption that the range would break down.
Meanwhile, something different was happening in the whale cohorts.
What the Whale Cohorts Were Doing
Large holders had been accumulating through the compression. Bitcoin whales added about 43,000 BTC over the 60 days leading into the squeeze, worth roughly $2.75 billion at the time. This accumulation ran quietly through the same range that retail was shorting.
On Hyperliquid specifically, the divergence was even sharper. Wallets running positions above $10 million held roughly $257 million in BTC longs against $126 million in shorts, a 2-to-1 imbalance tilted toward the upside. The largest perpetual-futures traders on the platform had shifted from net short to their most aggressively net-long Bitcoin positioning since early March.
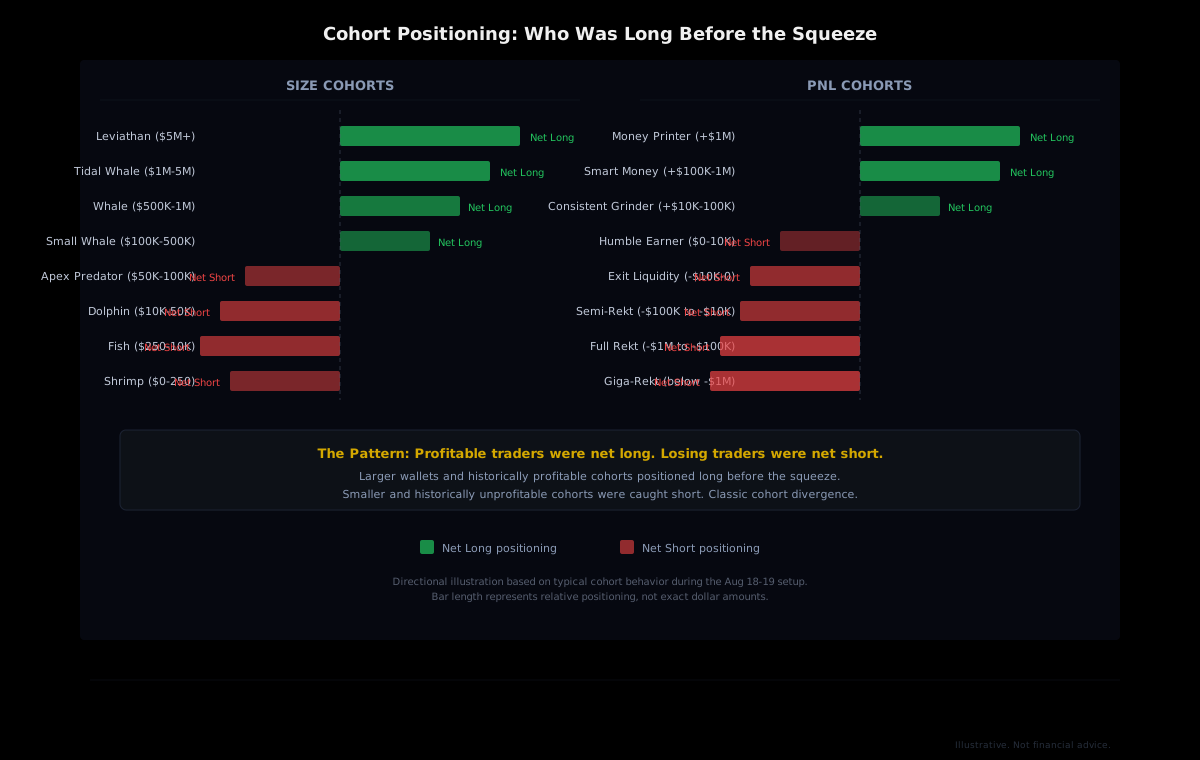
This is the classic cohort divergence signal. HyperTracker classifies every wallet on Hyperliquid into 16 behavioral cohorts: eight by account size (from Shrimp at $0-$250 to Leviathan at $5M+) and eight by all-time PnL (from Money Printer at +$1M to Giga-Rekt below -$1M). When the profitable, well-capitalized cohorts lean one direction while the losing cohorts lean the other, history suggests following the money.
The On-Chain Transparency Advantage
This kind of cohort-level read is possible because every position on Hyperliquid is on-chain. Entry price, size, margin, and liquidation level are all public the moment the order fills. That's fundamentally different from centralized exchanges, where wallet-level positioning data stays behind the firewall. On Hyperliquid, whale tracking is a data problem rather than a rumor problem.
And the data was clear: the traders who had made money historically were betting on a move higher, while the traders who had lost money historically were betting on a move lower.
The Catalyst: Treasury Buybacks and the Ignition Candle
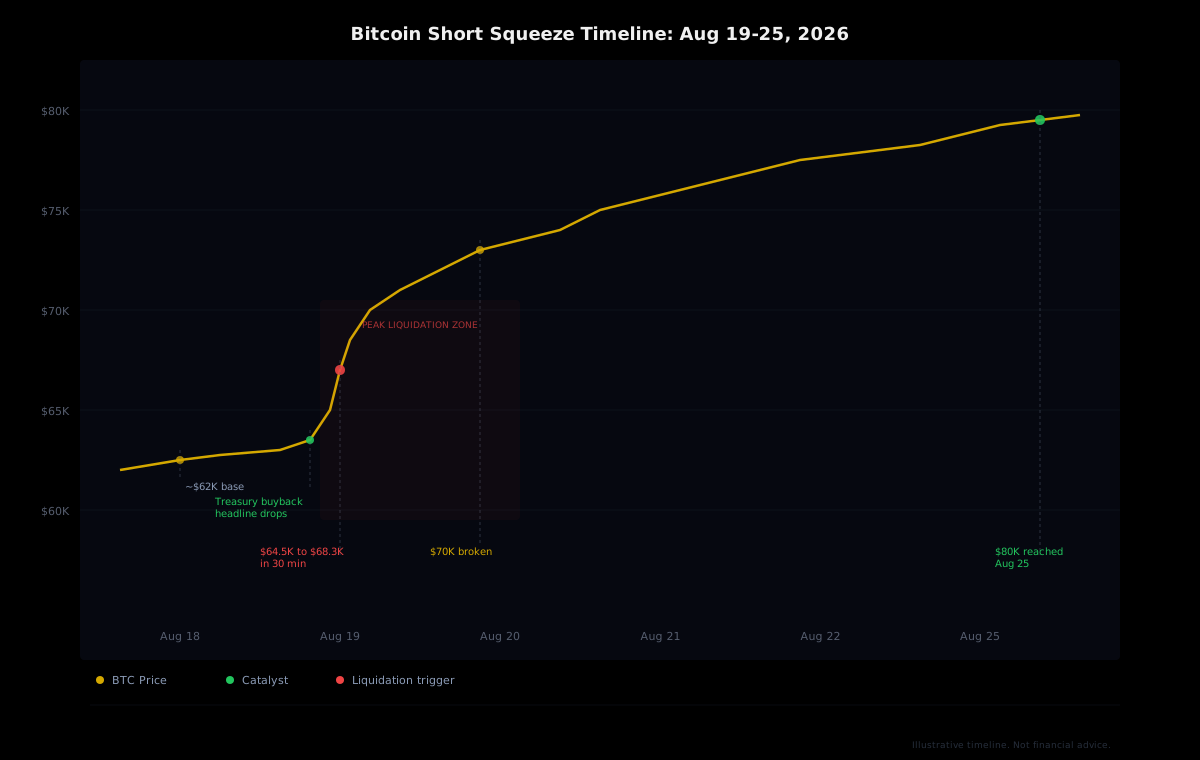
The spark landed on August 19 when the U.S. Treasury announced it would at least double the size of its long-dated bond buyback operations, raising the maximum from $2 billion to $4 billion per operation. Between 15:00 and 15:30 UTC, Bitcoin jumped from $65,896 to $68,284, a 3.6% move in 30 minutes.
That 30-minute candle was the ignition. Net taker buying in that window reached $2.22 billion across four venues simultaneously, the largest print of the entire week.
The Liquidation Cascade: Three Waves
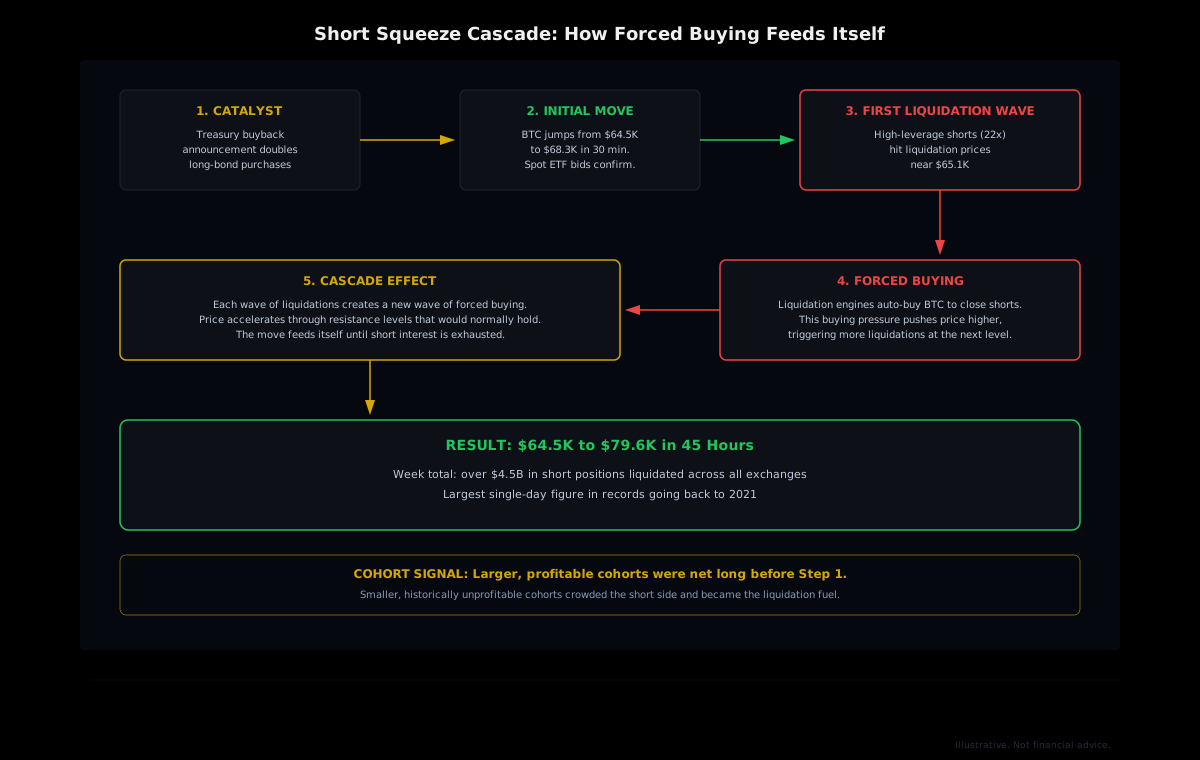
Short squeezes don't happen all at once. They cascade. Each wave of forced buying pushes price into the next cluster of liquidation levels, and the process feeds itself until the short interest is exhausted.
Wave 1: The High-Leverage Shorts
The first casualties were the most leveraged positions. Two well-known whale addresses on Hyperliquid (beginning with 0x8c96 and 0x431f) had built a combined 2,675 BTC short position at roughly $62,935, using 22x isolated leverage. Their liquidation prices sat just above $65,100. When BTC broke through $64,000-$64,400, these positions were doomed.
The math is unforgiving at 22x leverage. A 4.5% move against you wipes out your entire margin. These whales had 181 synchronized trades entered just 1.3 seconds apart, suggesting coordinated positioning that ultimately backfired spectacularly.
Wave 2: The Broad Liquidation Event
Once the high-leverage positions went, the cascade began. Short positions worth $1.23 billion were liquidated in just 60 minutes as Bitcoin climbed 2.5% to near $68,424. Three whale wallets on Hyperliquid absorbed $194 million of that damage alone: wallet 0x8c96 lost its entire 1,800 BTC short (roughly $117 million), wallet 0x431f was wiped out at 677 BTC ($44 million), and a third account, 0x004e, lost 500 BTC worth about $33 million.
Wave 3: The Grind Higher
By August 20, global liquidations reached $3.024 billion in 24 hours across 171,045 traders. The largest single liquidation that day was a $48.8 million BTC-USD position on Hyperliquid. Bitcoin pushed past $70,000 for the first time since June 2 and kept going, ultimately touching $80,000 on August 25.
The weekly total climbed past $4.5 billion in short liquidations, according to Bitwise. It was, by every measure, the defining liquidation event of 2026 so far.
Why Individual Whale Tracking Wasn't Enough
If you were tracking individual whale wallets during this period, you would have seen the 0x8c96 and 0x431f shorts building. That's useful information. But it's also incomplete, because those two wallets represented one directional bet from one entity. Following them would have pointed you short.
Cohort-level analysis told a different story. When you aggregate all wallets by size and by performance history, the signal gets much cleaner. The Leviathan cohort ($5M+ accounts) was net long. The Money Printer cohort (all-time PnL above +$1M) was net long. The Tidal Whale and Smart Money cohorts were net long. Every single large-wallet and profitable-history cohort was positioned for upside.
The cohorts that were net short? Fish ($250-$10K), Dolphin ($10K-$50K), Exit Liquidity (all-time PnL -$10K to $0), Semi-Rekt (-$100K to -$10K), Full Rekt, and Giga-Rekt. The traders who had historically lost money were the ones betting on further downside.
The signal: When profitable cohorts and losing cohorts disagree on direction, the profitable cohorts tend to be right. This divergence was visible days before the Treasury headline dropped.
The Confirmation Layer: ETF Flows
The cohort signal aligned with institutional behavior in traditional markets. U.S. spot Bitcoin ETFs pulled in $606.29 million in net inflows on August 20, the largest single-day haul since May 1. Over the four-day stretch from August 18-21, ETF inflows totaled approximately $1.62 billion, led by BlackRock.
This wasn't retail FOMO chasing the move. The ETF flow data confirmed what the on-chain cohort data had already suggested: institutional-scale capital was positioned for a move higher before the catalyst arrived. When the Treasury headline dropped, it validated the bet rather than creating it.
Reading the Squeeze with Cohort Analytics
Short squeezes are inherently hard to time. The catalyst is unpredictable. What's predictable is the setup: compressed volatility, crowded positioning on one side, and a divergence between smart money and the crowd. All three conditions were visible in cohort data before August 19.
Here's what a cohort-aware framework looks like in practice:
- Check cohort bias. Are the large-wallet and profitable cohorts net long or net short? If they disagree with the smaller and losing cohorts, that's a setup.
- Measure the divergence. A 2-to-1 long/short imbalance among $10M+ wallets is a strong signal. Smaller imbalances are harder to interpret as directional conviction.
- Watch the compression. Low realized volatility plus crowded one-sided positioning means the eventual move will be violent. Cohort data tells you which direction the violence is likely to run.
- Wait for the catalyst. Cohort data tells you the direction of the loaded spring. The catalyst is the finger that flicks it.
Our data made this readable. HyperTracker's cohort analytics classify every active wallet on Hyperliquid into 16 behavioral segments, updated every 5 minutes. That means you can track how the Leviathan cohort's positioning shifts relative to the Fish cohort in near-real time, without needing to identify individual whales or guess at centralized exchange data.
Track Cohort Divergence Before the Next Squeeze
HyperTracker classifies every Hyperliquid wallet into 16 behavioral cohorts by size and PnL. See when smart money disagrees with the crowd, delivered through our API, dashboard, and alerts.
Explore HyperTracker Free Tier
What Comes Next
Bitcoin traded near $80,000 on August 25 as open interest in BTC-denominated perpetual futures fell to 587,600 BTC, a five-month low. Margin futures OI dropped to a historic low of 52,000 BTC. That's a cleaned-out market. Most of the leveraged shorts have been flushed.
The question now is whether genuine spot demand sustains these levels, or whether this was purely a short-covering rally that fades. Perpetual funding rates remain below 10% annualized, which means longs aren't paying heavy carry costs yet. That's constructive.
But the token still sits well below its October peak of about $126,000. The easy money from the short squeeze has been made. From here, the cohort data will tell us whether smart money is holding or distributing into strength.
That's the signal to watch. The squeeze was violent and profitable for anyone positioned correctly. The next chapter depends on whether the Money Printers and Leviathans keep their longs, or start taking profit into the bid. Our cohort analytics will show it when they do.