
Uptober Meets $18B in Open Interest: What Hyperliquid Cohorts Reveal
By CMM Team - 02-Oct-2026
Uptober Meets $18B in Open Interest: What Hyperliquid Cohorts Reveal
October has arrived, and crypto traders everywhere are dusting off the same playbook. Bitcoin gained roughly 10% in September, marking its strongest September in over a decade, and now enters the month historically known as "Uptober" with momentum, institutional inflows, and a Hyperliquid open interest record of $18 billion behind it.
But seasonal labels are cheap. October 2025 proved that when Bitcoin touched $126,080 and still finished the month in the red, snapping a six-year winning streak. The question for October 2026 is whether the market's positioning, measured in actual leveraged bets across behavioral cohorts, supports the narrative. Seasonality tells you what usually happens. Cohort data tells you who is positioned and how much conviction they're carrying.
The Uptober Track Record: Strong, With Caveats
Bitcoin has finished October higher in 10 of the last 13 years (2013 through 2025), with an average return of about 19%. The three negative years were 2014, 2018, and 2025. Each coincided with either post-halving exhaustion, a broader bear market, or a macro shock that overwhelmed the seasonal tailwind.
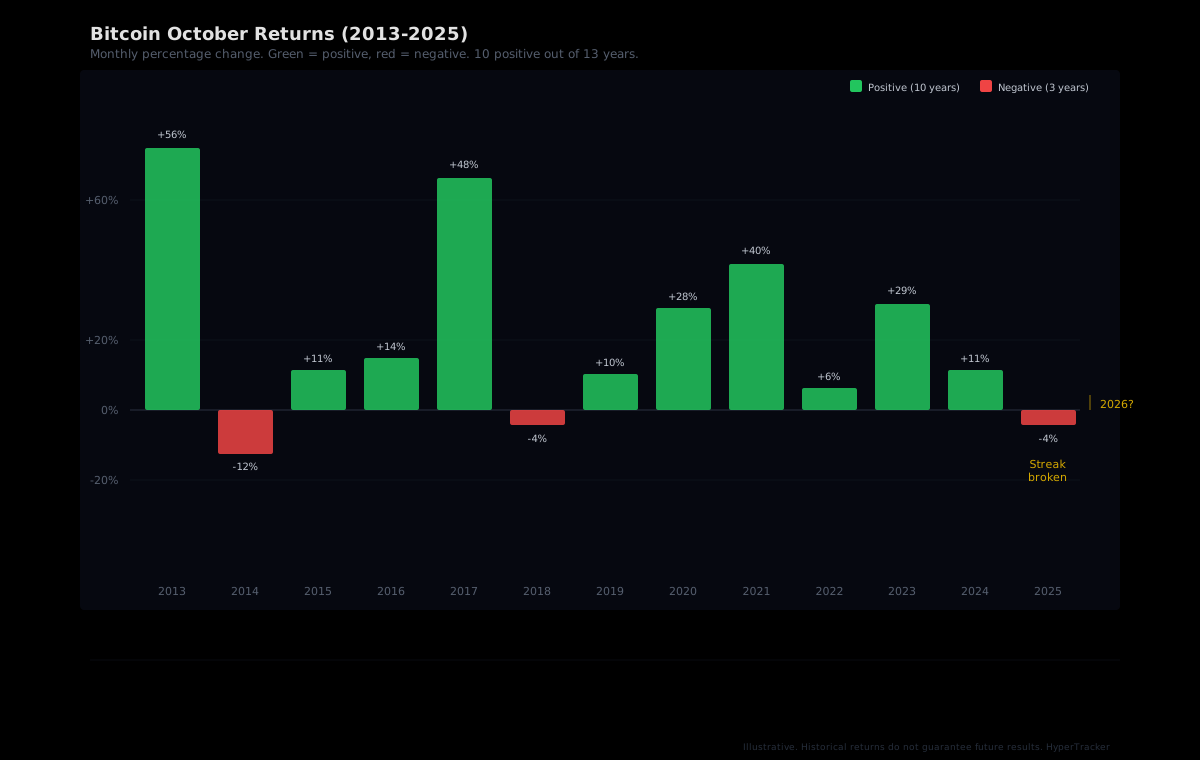
October 2025 is the most instructive precedent. Bitcoin entered that month at all-time highs near $119K, briefly pushed above $126K, then fell roughly 4% by month's end as US-China trade tensions triggered a wave of risk-off selling. The lesson was clear: seasonality can support a trend already in motion, but it cannot rescue one that's facing real headwinds.
So the framework is simple. Don't ask "is it Uptober?" Ask whether the setup underneath the seasonal label is bullish, neutral, or fragile. In 2026, the setup is worth examining in detail.
What October 2026 Starts With
The backdrop entering this October is materially different from last year. Bitcoin is trading around $85,000, still roughly 33% below its all-time high, which means there's room to run before bumping into prior resistance. Last October started at all-time highs with nowhere to go but down if sentiment soured.
Spot Bitcoin ETFs pulled in approximately $2.65 billion in net inflows during September, making it the second-largest monthly inflow since October 2025. That institutional capital isn't sitting on the sidelines. It's in the market, creating a baseline of demand that didn't exist during previous Uptober cycles.
Bitcoin also closed Q3 with its best July-through-September run since 2012, posting three consecutive monthly gains. Momentum, measured by any standard technical indicator, is firmly bullish. But momentum alone doesn't tell you who's driving it or whether the positioning is crowded.
$18 Billion in Open Interest: What the Record Means
On September 23, Hyperliquid's total open interest crossed $18 billion for the first time, setting a record that reflects both the platform's growing dominance in perp DEX markets and the broader appetite for leveraged crypto exposure heading into Q4.
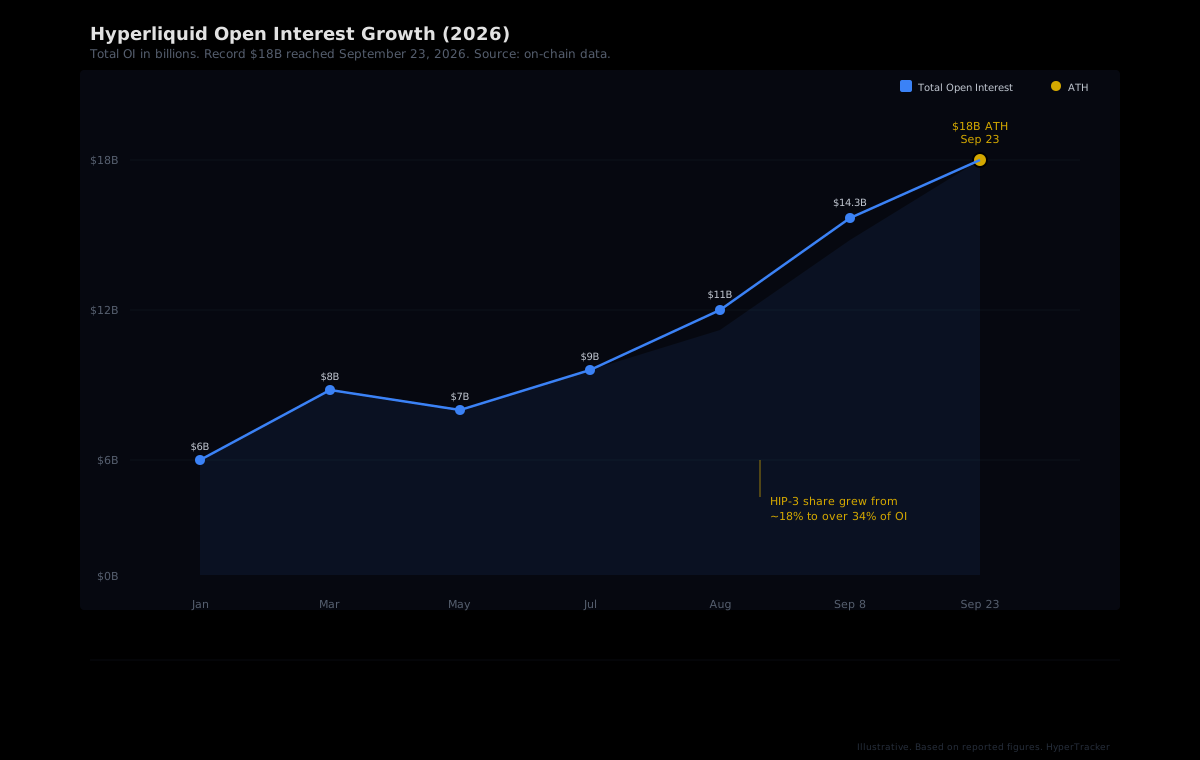
For context, Hyperliquid's OI stood at roughly $14.3 billion in early September. The jump to $18B over the course of three weeks signals aggressive positioning, with new leveraged bets opening faster than the price itself moved. When OI rises faster than price, it typically means traders are adding new positions (both long and short) in anticipation of a directional move, not simply riding existing trends higher.
The composition matters too. HIP-3 markets, which cover stocks, commodities, and other non-crypto assets, now account for roughly 30% of Hyperliquid's trading volume and have accumulated over $548 billion in cumulative volume. That diversification means the $18B OI figure isn't purely a crypto directional bet. A portion represents hedging, macro positioning, and cross-asset strategies that make the overall open interest more structurally resilient.
Why OI context matters: High OI entering a historically bullish month creates the conditions for amplified moves. If October delivers a rally, leveraged longs profit and OI may consolidate. If it disappoints, the unwind of $18B in positions could produce volatility that dwarfs the seasonal average.
Reading Cohort Positioning Into a Seasonal Move
This is where seasonal narratives meet on-chain reality. HyperTracker classifies every wallet on Hyperliquid into 16 behavioral cohorts: eight by account size (Shrimp through Leviathan) and eight by all-time PnL (from Giga-Rekt to Money Printer). Pulling cohort-level positioning data heading into October reveals patterns that aggregate OI numbers obscure.
What to look for in the PnL cohorts
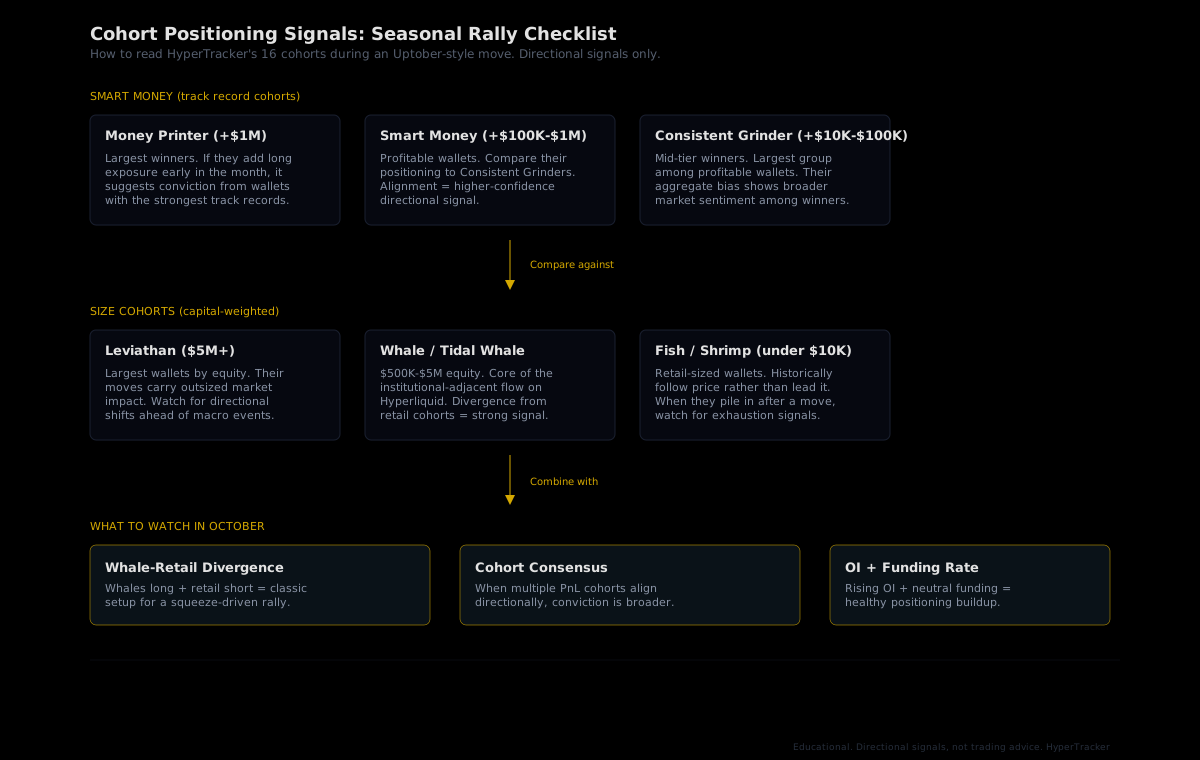
The PnL-based cohorts tell you about conviction quality. Money Printer wallets (all-time PnL above $1M) have the longest track records of profitable trading. When they add directional exposure early in a month, it's a signal worth watching, because these wallets have survived multiple cycles and aren't chasing retail narratives. Smart Money ($100K to $1M all-time PnL) provides a similar lens at slightly broader scale.
Contrast that with the lower PnL cohorts. Exit Liquidity (wallets with slightly negative all-time PnL) and Semi-Rekt (down $10K to $100K) tend to follow price rather than anticipate it. If these cohorts pile into longs after a rally is already underway, it often signals late-stage positioning, the kind that adds fuel to a top rather than supporting a base.
What size cohorts add to the picture
Leviathan wallets ($5M+ in perp equity) move markets when they reposition. Their trades are large enough to create detectable order flow patterns. Whale and Tidal Whale ($500K to $5M) represent the institutional-adjacent capital on Hyperliquid, wallets that likely have risk management frameworks and aren't trading on vibes alone.
The signal gets interesting when you compare across axes. If Leviathan and Money Printer cohorts are both adding long exposure while Fish and Shrimp (under $10K) remain neutral or short, that divergence points to informed capital leading into a move before retail catches on. If everyone from Leviathan to Shrimp is long simultaneously, the trade is crowded and vulnerable to a washout.
Why This October Is Structurally Different
Three factors separate October 2026 from prior Uptober setups:
ETF infrastructure has matured. Spot Bitcoin ETFs have been trading for over two years now. September's $2.65 billion in net inflows weren't a novelty-driven spike. They represent consistent institutional allocation into Bitcoin as a portfolio asset. That structural demand creates a bid floor that previous Octobers simply didn't have.
Hyperliquid has expanded well beyond crypto-native perps. HIP-3 markets now span equities, commodities, and real-world assets, meaning the positioning data on the platform reflects cross-asset strategies. A whale going long BTC perps while also carrying a short position in an equity futures market is making a fundamentally different bet than a degen aping into a leveraged long. Cohort data captures both, and the distinction matters when assessing conviction.
The starting price is mid-range, not parabolic. At roughly $85K and 33% below the all-time high, Bitcoin has clear technical room to rally without running into the "new highs, now what?" problem that stalled October 2025. The path of least resistance points up unless a macro shock intervenes.
The Macro Risks That Could Override Seasonality
No seasonal framework works in a vacuum. October 2025 proved that, and the same class of risks remains relevant:
- Interest rate uncertainty: Bond yields remain elevated, and the path of Fed policy is unclear. If rate-hike expectations increase during October, risk assets across the board face selling pressure that no seasonal pattern can counter.
- Geopolitical friction: Oil supply disruptions, trade policy shifts, or escalation in ongoing conflicts can trigger risk-off moves that hit crypto disproportionately because of its 24/7 liquidity profile. Crypto markets are where global risk gets priced on weekends.
- Positioning unwind risk: $18B in open interest is a double-edged record. If a catalyzing event triggers forced liquidations, the cascade through leveraged positions amplifies the move in both directions. The bigger the OI, the bigger the potential forced selling.
Cohort data helps here. If Money Printer and Leviathan wallets begin reducing exposure before a macro event, it's a leading indicator that institutional-grade participants see risk the market hasn't priced yet. If they hold or add, it suggests confidence that the setup will survive the turbulence.
How to Use Cohort Data This Month
Whether October delivers an Uptober rally, a sideways grind, or a repeat of last year's disappointment, the playbook for reading cohort positioning stays the same:
- Track the divergence. Compare Leviathan/Whale positioning against Fish/Shrimp. When the largest wallets are directionally opposite the smallest, the larger wallets are typically leading. When everyone agrees, the trade is crowded.
- Watch the PnL cohort alignment. If Money Printer, Smart Money, and Consistent Grinder all tilt the same direction, that's broad consensus among historically profitable traders. One cohort alone is noise. Three together is signal.
- Monitor OI composition. Rising OI with stable funding rates suggests organic positioning buildup. Rising OI with sharply positive or negative funding rates suggests leveraged speculation that's vulnerable to a squeeze.
- Don't trade the label. "Uptober" is a meme, not a strategy. Use it as context for the calendar. Let the positioning data tell you whether the trade is actually there.
Track Cohort Positioning Into October
HyperTracker gives you 16 behavioral cohorts, real-time order flow, and liquidation risk scoring, all through a single API. See what smart money is doing before, during, and after seasonal moves.
Seasonal Narratives vs. On-Chain Positioning
Every October, the same articles circulate: "Uptober is here, history says buy." And in 10 of the last 13 years, that advice would have worked. But the three times it didn't, traders who relied on the seasonal label without checking the underlying positioning took meaningful losses.
The point of cohort analytics isn't to predict whether October will be green or red. It's to show you who is positioned, how much leverage they're using, and whether the wallets with the best track records are aligned with the narrative or quietly moving the other way. That's the difference between trading a meme and trading with data.
Hyperliquid just set an $18 billion open interest record. Spot ETFs just posted their second-best inflow month on record. Bitcoin gained roughly 10% last month. The setup is bullish on paper. Whether it holds depends on what happens in the next 30 days, and our data shows you who's betting on it, in real time.