
What Full Rekt and Giga-Rekt Wallets Have in Common
By CMM Team - 03-Jul-2026
What Full Rekt and Giga-Rekt Wallets Have in Common
Somewhere on Hyperliquid right now, a wallet is about to add to a losing position for the third time today. The first entry was a calculated bet. The second was conviction. The third is desperation, funded by margin that the trader cannot afford to lose, at leverage that turns a minor wick into a full liquidation.
That wallet is almost certainly in one of two cohorts: Full Rekt (all-time PnL between -$100K and -$1M) or Giga-Rekt (below -$1M). These are the wallets that have lost the most money in the history of Hyperliquid perps, and they did not get there by being unlucky. They got there by repeating the same set of behavioral patterns until the math caught up with them.
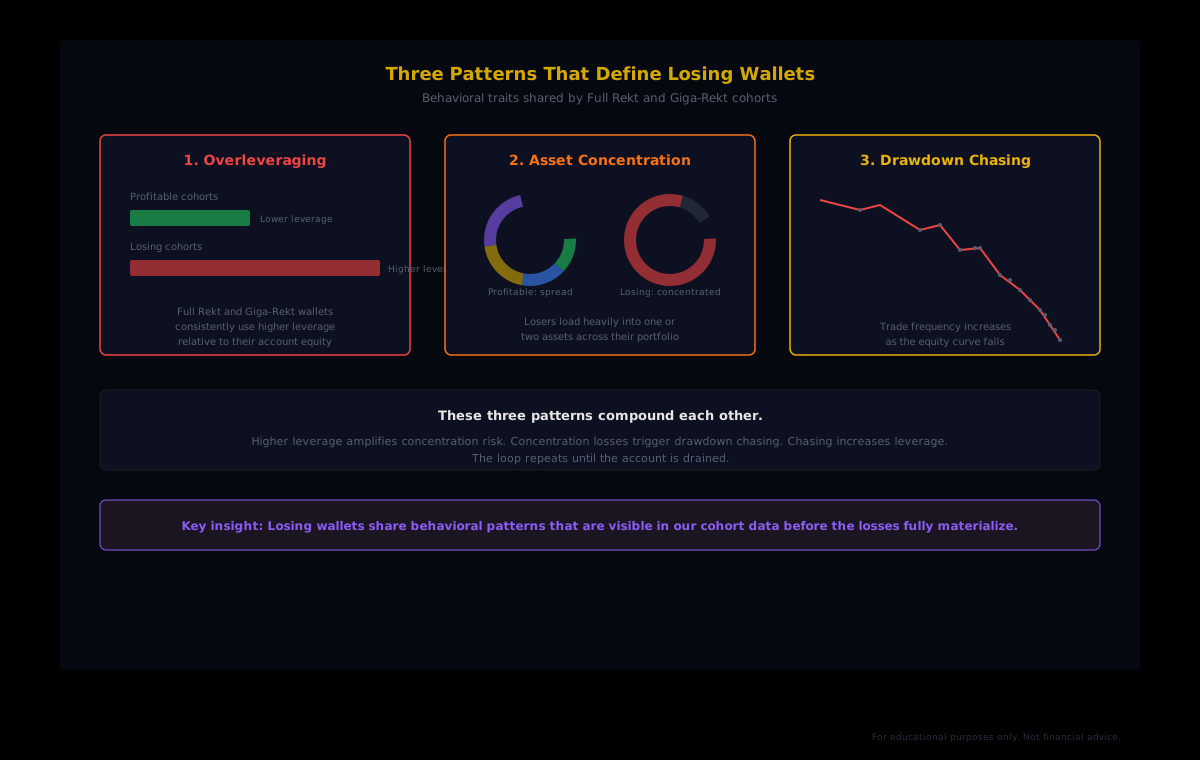
HyperTracker classifies every wallet on Hyperliquid into one of 16 behavioral cohorts, eight based on account size and eight based on all-time PnL. The two lowest PnL tiers, Full Rekt and Giga-Rekt, contain wallets that have collectively lost staggering amounts. But the losses are not random. Our cohort data reveals a behavioral fingerprint: overleveraging, heavy asset concentration, and compulsive drawdown chasing. The same three patterns, repeated across thousands of addresses, producing the same outcome every time.
Understanding these patterns is not morbid curiosity. It is a risk management exercise. If you can see the behavioral signature of a losing wallet, you can check your own trading against it. And if you build with our API, you can use losing cohort positioning as a contrarian signal.
Where Full Rekt and Giga-Rekt sit in the cohort map
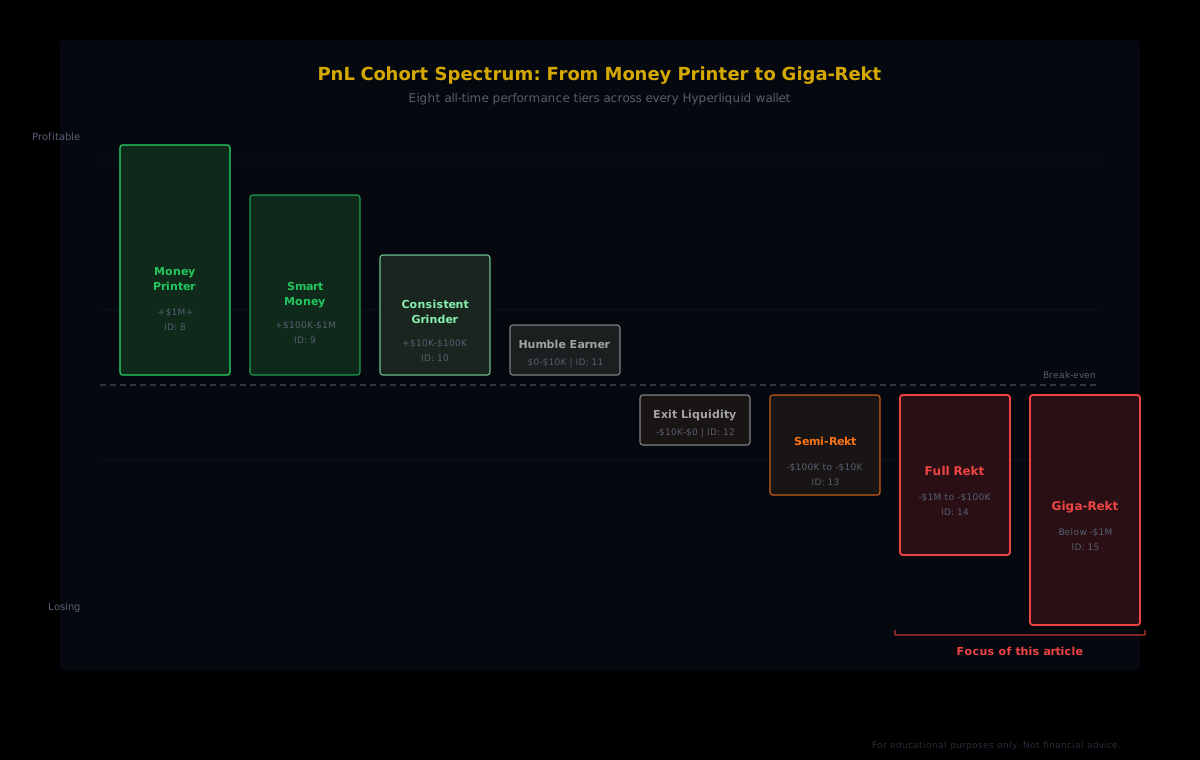
HyperTracker's PnL-based classification system divides every wallet into eight tiers based on cumulative all-time profit and loss on Hyperliquid perps:
| Cohort | PnL Range | Segment ID | | --- | --- | --- | | Money Printer | +$1M and above | 8 | | Smart Money | +$100K to +$1M | 9 | | Consistent Grinder | +$10K to +$100K | 10 | | Humble Earner | $0 to +$10K | 11 | | Exit Liquidity | -$10K to $0 | 12 | | Semi-Rekt | -$100K to -$10K | 13 | | Full Rekt | -$1M to -$100K | 14 | | Giga-Rekt | Below -$1M | 15 |
The naming is intentionally blunt. A wallet does not end up in Full Rekt or Giga-Rekt because of one bad trade. Cumulative losses of $100K to $1M (Full Rekt) or more than $1M (Giga-Rekt) take sustained, repeated losing behavior across many positions over time. These are not unlucky traders. They are traders whose process is broken in specific, observable ways.
Pattern one: overleveraging relative to account size
The most consistent signal across losing cohorts is leverage usage that is disproportionate to account equity. Every trader uses leverage. That is the nature of perpetual futures. But profitable cohorts like Money Printer and Smart Money tend to use leverage that leaves room for the position to breathe through normal volatility. Losing cohorts use leverage that turns every wick into a liquidation threat.
The mechanism is straightforward. A wallet with $50K in equity opens a 20x leveraged position, creating $1M in notional exposure. A 5% adverse price move wipes out the entire position. On Hyperliquid, where assets like BTC and ETH regularly move 3-7% within a 24-hour period, that kind of leverage leaves almost no margin for error.
Profitable wallets, by contrast, tend to size their leverage so that normal volatility does not threaten their positions. Our data shows that the higher a wallet's cumulative profitability, the more conservative its average leverage tends to be relative to account equity. This is not because profitable traders are timid. It is because surviving long enough to compound gains requires positions that can absorb drawdowns without forced liquidation.
The irony is that Full Rekt and Giga-Rekt wallets often started with smaller accounts and used high leverage to try to grow them quickly. The leverage that was supposed to accelerate gains instead accelerated losses, because it left no room for the inevitable strings of losing trades that every strategy produces.
Pattern two: heavy asset concentration
Profitable wallets tend to spread their exposure across multiple assets. Not because diversification is always optimal in perps trading, but because concentration in a single asset creates fragility. If your entire portfolio is a leveraged long on one token and that token drops sharply, everything goes wrong at the same time. There is no uncorrelated position to offset the drawdown.
Our cohort data shows that wallets in the losing PnL tiers tend to concentrate a much larger share of their total notional exposure in a single asset compared to wallets in profitable cohorts. When a Full Rekt wallet opens positions, a disproportionate share of their exposure tends to be in one or two tokens.
This concentration problem compounds with overleveraging. If you concentrate 80% of your portfolio in a single asset and apply high leverage, you have created a position where a single price move in one direction can produce catastrophic loss. Diversified wallets with the same total notional exposure would absorb the same move with a smaller percentage drawdown because some positions would be uncorrelated or directionally offsetting.
The behavioral driver is usually conviction. Losing traders become convinced that a particular asset is going to move in a particular direction, so they load up. When it does not move as expected, they add more rather than cutting. This turns what might have been a manageable loss on a single position into a portfolio-level catastrophe.
Pattern three: drawdown chasing
This is the behavioral signature that distinguishes losing wallets from everyone else. When profitable wallets take a loss, they typically reduce position sizes or stop trading temporarily. When losing wallets take a loss, they increase position sizes and trade more frequently. The instinct to "make it back" overrides risk management, and the result is a vicious cycle where each loss leads to a larger, more aggressive follow-up trade.
Our data shows this pattern clearly in trade frequency. Wallets in Full Rekt and Giga-Rekt cohorts tend to increase their number of trades per day during drawdown periods. Rather than stepping back to reassess, they step on the gas. Each new position is an attempt to recover the previous loss, and each failed recovery attempt increases the urgency (and the risk) of the next one.
Drawdown chasing interacts with the first two patterns in a destructive feedback loop. The trader loses money because of overleveraging. The loss creates emotional pressure to recover. The recovery attempt involves even higher leverage. If the recovery trade also fails, the trader concentrates more aggressively into their "best idea," creating the concentration problem from pattern two. By the time the spiral ends, the account has gone from a moderate loss to Full Rekt or beyond.
The key insight for anyone monitoring their own behavior: if you notice that your trade frequency is increasing during a losing streak, that is the single strongest warning sign that you are replicating the exact pattern that defines the bottom two cohorts. The correct response, and the one that profitable cohorts demonstrate, is to reduce trading activity during drawdowns.
How these patterns show up in our API
If you are building a trading system, risk dashboard, or portfolio monitoring tool, you can use HyperTracker's API to detect these patterns in real time. The relevant endpoints expose cohort-level positioning, individual wallet classification, and aggregate metrics that make losing-cohort behavior visible.
Querying a wallet's cohort classification
To check where any wallet sits in the PnL cohort spectrum, use the wallets endpoint:
import requests

API_BASE = "https://ht-api.coinmarketman.com/api/external"
headers = {"Authorization": "Bearer YOUR_JWT_TOKEN"}

wallet = requests.get(
    f"{API_BASE}/wallets",
    headers=headers,
    params={"address[]": "0xabc...target", "limit": 1}
).json()

segment_ids = wallet[0].get("segmentIds", [])
# PnL cohorts: 8=Money Printer, 9=Smart Money,
# 10=Consistent Grinder, 11=Humble Earner,
# 12=Exit Liquidity, 13=Semi-Rekt,
# 14=Full Rekt, 15=Giga-Rekt

pnl_cohort = next((s for s in segment_ids if 8 <= s <= 15), None)
if pnl_cohort and pnl_cohort >= 14:
    print("Warning: wallet is in a losing cohort")
This is useful for building filters. If you run a copy trading system, you might exclude any wallet classified as Full Rekt or below. If you run a counter-trading system, you might pay closer attention when losing cohorts pile into a direction.
Monitoring cohort-level positioning for contrarian signals
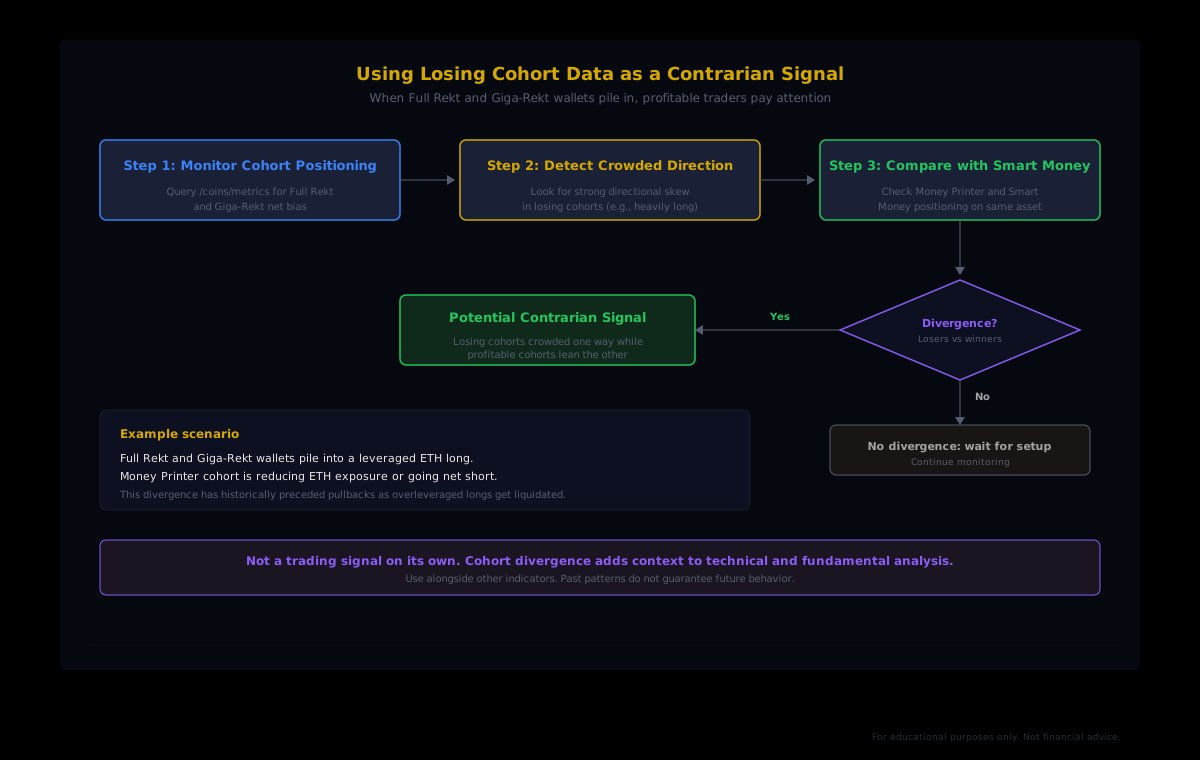
The aggregate positioning of Full Rekt and Giga-Rekt wallets can serve as a contrarian indicator. When these cohorts collectively skew heavily in one direction on an asset, it often means overleveraged traders are crowding into a consensus view. When that consensus is wrong, the resulting liquidations can accelerate the move in the opposite direction.
Use the /coins/metrics endpoint to track cohort-level bias by asset:
# Get positioning data for a specific asset
metrics = requests.get(
    f"{API_BASE}/coins/metrics",
    headers=headers,
    params={"coin": "ETH", "segmentId": 14}  # Full Rekt
).json()

# Compare with Money Printer positioning
mp_metrics = requests.get(
    f"{API_BASE}/coins/metrics",
    headers=headers,
    params={"coin": "ETH", "segmentId": 8}  # Money Printer
).json()

# Look for divergence: losing cohort heavily long
# while profitable cohort is reducing or short
When Full Rekt wallets are heavily long on an asset while Money Printers are reducing exposure or leaning short, that divergence deserves attention. It does not guarantee a reversal. But it adds a data point that most traders do not have access to, because most analytics tools do not classify wallets by cumulative profitability.
What profitable wallets do differently
The contrast with Money Printer and Smart Money cohorts is instructive. Wallets that have generated $100K to $1M+ in cumulative profits exhibit the inverse of each losing pattern:
- Conservative leverage relative to equity. Profitable wallets tend to use lower effective leverage, which keeps positions alive through the volatility that liquidates overleveraged accounts. The position survives long enough for the edge to play out.
- Broader exposure distribution. Rather than concentrating in a single asset, profitable wallets spread their notional across multiple instruments. This does not eliminate directional risk, but it prevents a single adverse move from threatening the entire portfolio.
- Reduced activity during drawdowns. When profitable wallets hit losing streaks, trade frequency tends to decrease. They step back, reassess, and wait for better setups. This is the opposite of the drawdown chasing pattern that defines losing cohorts.
None of this is groundbreaking on its own. "Use less leverage, diversify, and trade less when losing" is textbook risk management. The value of our cohort data is that it quantifies these behaviors at scale across thousands of wallets, and it makes them visible through a single API call. You do not have to guess whether your process looks more like a Money Printer or a Full Rekt wallet. You can compare.
Checking your own wallet against the pattern
If you trade on Hyperliquid, you can look up your own wallet's cohort classification through HyperTracker. The PnL cohort tells you where your cumulative results place you. But the cohort label is a lagging indicator. By the time you are classified as Full Rekt, the damage is done.
The leading indicators are the behavioral patterns themselves. Ask yourself three questions:
- Am I using higher leverage than I would on a paper trade? If your real positions run at higher leverage than your backtested or simulated positions, you are using leverage for emotional reasons (excitement, urgency, recovery pressure) rather than strategic ones.
- Is more than half of my notional exposure in a single asset? Conviction is fine. But when a single asset dominates your portfolio at high leverage, you have created a binary outcome: either the trade works, or your account takes a serious hit. That binary fragility is the structural signature of Full Rekt wallets.
- Am I trading more frequently after a losing day? This is the hardest one to admit. Track your daily trade count alongside your daily PnL. If the two are inversely correlated, meaning you trade more on losing days, you are exhibiting the exact drawdown chasing behavior that defines the bottom two cohorts.
If you answer yes to two or more of these, the behavioral pattern matches the losing cohort profile regardless of your current PnL. The cohort classification will catch up eventually. Fixing the process before that happens is the entire point of this analysis.
See Where Your Wallet Sits
HyperTracker classifies every Hyperliquid wallet into 16 behavioral cohorts, eight by account size and eight by all-time PnL. Query any wallet's cohort, compare positioning across tiers, and build risk filters using our API. The free tier includes 100 requests per day.
Check Your Cohort Classification
The losing cohort as market signal
There is a final layer to this analysis that matters for any builder working with cohort data. Full Rekt and Giga-Rekt wallets are not just cautionary tales. They are market participants whose aggregate behavior creates predictable dynamics.
When losing cohorts pile into a leveraged direction, they create a cluster of liquidation risk at a specific price level. If the market moves against their consensus, the resulting cascade of forced closures amplifies the price move. This is the mechanism behind the sharp wicks that dominate Hyperliquid price action: overleveraged wallets in the losing cohorts get liquidated, their forced sells or buys push the price further, which triggers more liquidations.
Our liquidation heatmap visualizes these clusters. But the cohort layer adds something the heatmap alone cannot show: it tells you who is sitting at those liquidation levels. When the exposed wallets are predominantly Full Rekt and Giga-Rekt, the probability of a cascade is higher because those wallets are less likely to have risk management in place to exit before the liquidation engine takes over.
That is the anatomy of a losing wallet. The overleveraging, the concentration, the drawdown chasing: they do not just destroy the individual account. They create the volatility events that the rest of the market trades around. Understanding these patterns makes you a better trader. Building with this data makes your tools smarter than anything that treats every wallet as equal.