
When Every Cohort Leans Long, Who's Left to Buy?
By CMM Team - 06-Sep-2026
When Every Cohort Leans Long, Who's Left to Buy?
Crowded trades don't announce themselves. They build slowly, position by position, until every segment of the market leans the same way. Then someone sells, and the crowd discovers that the buyer it needed was already long.
This is the oldest problem in leveraged markets, and perpetual futures make it worse. On Hyperliquid, where funding settles every hour and liquidation engines run continuously, a crowded long trade doesn't just cost you the funding drag. It exposes you to a cascade where forced closures feed more forced closures, because the entire market was positioned for a move that already happened. Cohort-level positioning data lets you see this crowding develop before the unwind begins, which is the difference between reading the risk and becoming part of it.
What Makes a Trade "Crowded"
A crowded trade isn't simply a popular one. Bitcoin is always the most traded asset on Hyperliquid. That popularity alone tells you nothing about positioning risk. A trade becomes crowded when the balance between longs and shorts skews so far that the minority side can't absorb the other's exit.
Think about it mechanically. Every perpetual futures position has a counterparty. When you go long, someone else takes the short side. In a balanced market, this exchange flows naturally. Longs pay shorts when funding is positive, shorts pay longs when it's negative, and the price stays close to spot. But when positioning tilts heavily in one direction, the market structure changes. The crowded side pays increasingly expensive funding. The minority side collects it but thins out, meaning there are fewer natural counterparties to absorb selling if the crowded side needs to exit.
The result is a market that looks healthy on the surface but is fragile underneath. Price can keep rising for days while the crowding builds. The danger isn't visible in the price chart alone. You need to see the positioning beneath it.
Why Cohort Data Exposes Crowding That Aggregate Metrics Miss
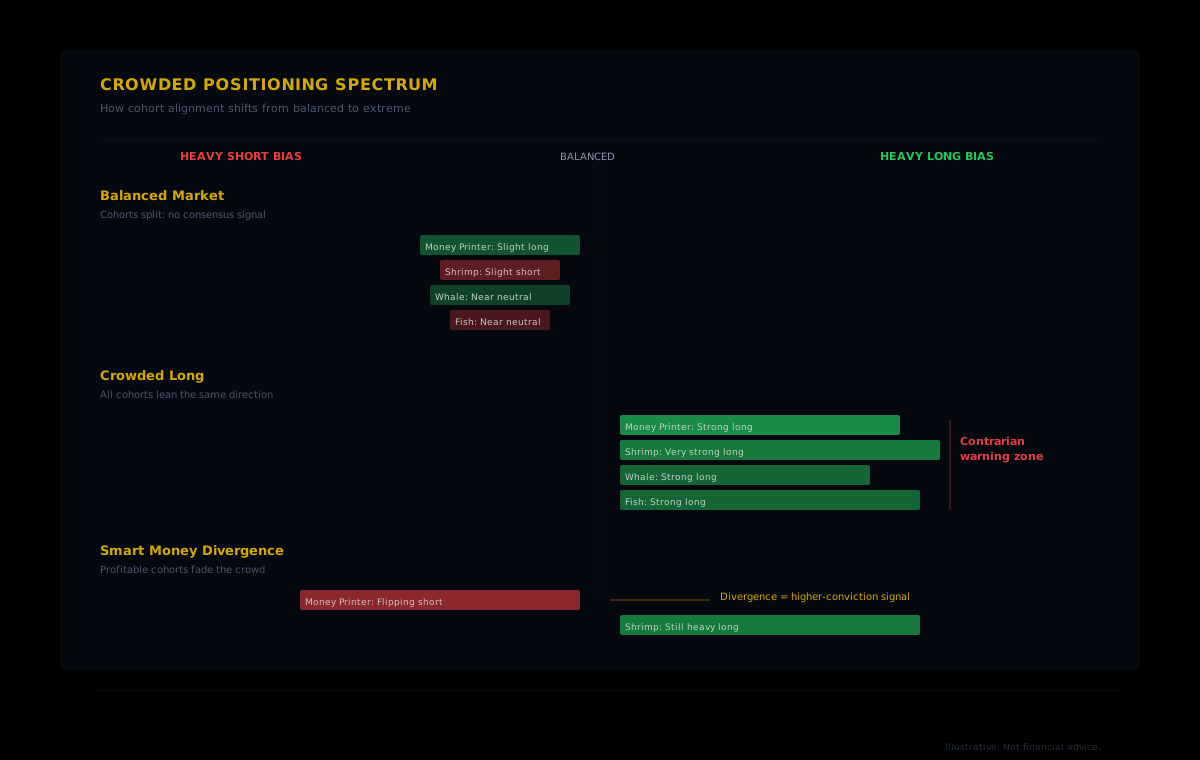
Traditional positioning metrics, like exchange-level long/short ratios, give you a single number. Imagine the market is heavily long. That's useful, but it flattens a complex picture into a crude average. A market that is broadly long because Shrimp accounts are piling in with leverage is fundamentally different from one that is broadly long because Whales and Money Printers are building conviction positions.
HyperTracker's 16 behavioral cohorts break positioning into segments that behave differently under stress. The eight size-based cohorts (Shrimp through Leviathan) tell you who is positioned. A Shrimp ($0-$250 perp equity) running leveraged longs will get liquidated at a much smaller adverse move than a Leviathan ($5M+) holding the same directional bias at lower leverage. The eight PnL-based cohorts (Money Printer through Giga-Rekt) tell you how good those positioned traders actually are at this. When the Full Rekt cohort (lifetime losses between $100K and $1M) is strongly long while the Money Printer cohort (lifetime profits above $1M) starts reducing, the signal is more specific than any aggregate ratio can offer.
The power of cohort positioning data is in the comparison. One cohort leaning long is a data point. All 16 cohorts leaning long is a crowded trade. And when the profitable cohorts start fading the move while the unprofitable ones keep adding, that divergence is the highest-conviction signal the data can give you.
The Anatomy of a Crowded Trade on Hyperliquid
Crowded trades follow a recognizable pattern, and each phase shows up in cohort data before it shows up in price.
Phase 1: Consensus builds
An asset starts moving. Early movers (typically the smaller PnL cohorts chasing momentum and the larger size cohorts building strategic positions) go long. Funding ticks positive but stays manageable. The trade feels comfortable because price is confirming the thesis.
Phase 2: Crowding develops
More capital enters. Cohort after cohort tips from mixed to long-biased. Funding rises because long demand outpaces short supply. On Hyperliquid, this hourly funding cost accumulates faster than on exchanges with 8-hour settlement periods, which means the carrying cost of a crowded position compounds three times as fast. Open interest climbs alongside price, meaning new leveraged capital is entering the trade, and the liquidation risk surface expands.
Phase 3: Smart money diverges
Here is where cohort data earns its keep. The Money Printer and Smart Money cohorts, the wallets with lifetime profits above $100K, begin reducing their long exposure or flipping short. Meanwhile, the Exit Liquidity and Semi-Rekt cohorts, the wallets that have historically been on the wrong side, keep adding. This divergence is the clearest pre-reversal signal available because it represents experienced capital positioning against the crowd while the crowd doubles down.
Phase 4: The unwind
A catalyst arrives. It might be a macro headline, a large sell order, or simply gravity: price dips enough to trigger the first layer of liquidations among the most leveraged small accounts. Those forced closures push price lower, triggering the next layer. The cascade feeds itself. Cohorts that were uniformly long start getting mechanically unwound from the bottom up, smallest and most leveraged first.
Funding Rates: The Carrying Cost of Crowding
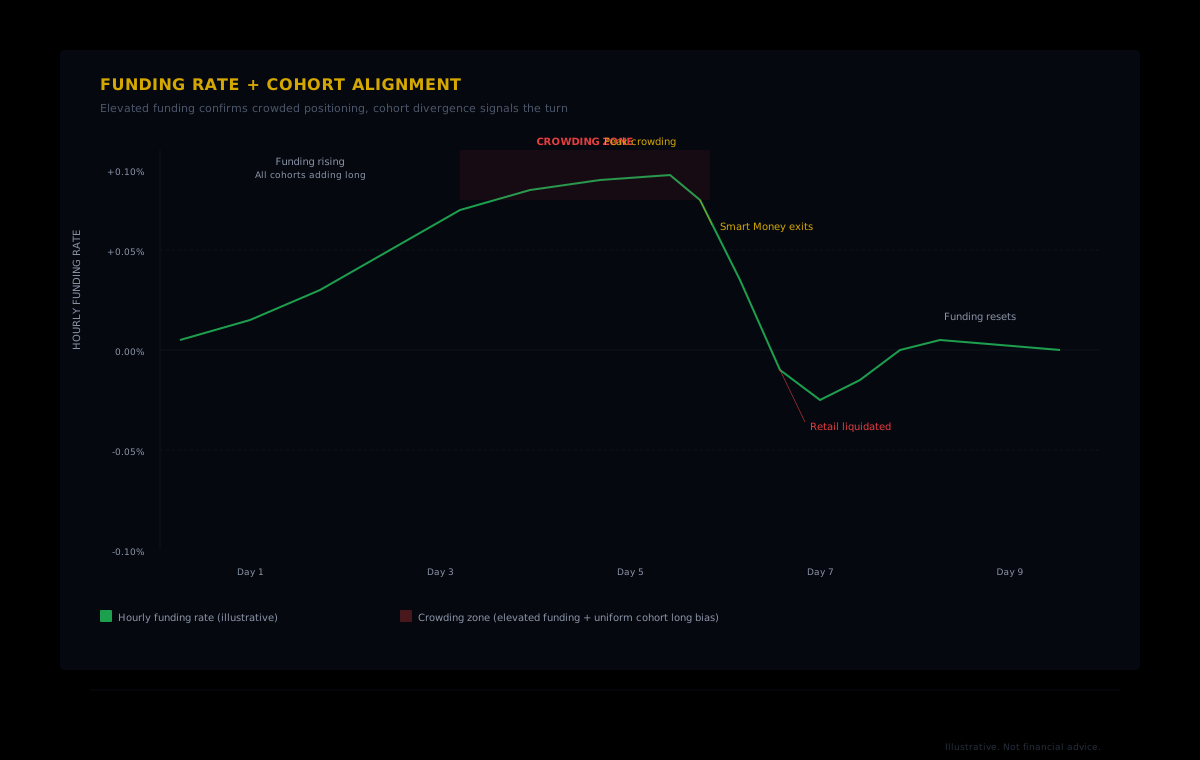
Funding is the market's built-in pressure valve for crowded positioning, and Hyperliquid's hourly settlement cycle makes it a sharper signal than on most exchanges.
When longs dominate, the funding rate goes positive, meaning long holders pay short holders every hour. This is designed to incentivize new short positions and discourage excessive long crowding. In a mildly bullish market, funding might sit around 0.005% per hour, a manageable cost. But when crowding becomes extreme, funding can spike to multiples of that baseline. At elevated levels, a leveraged long position pays a meaningful percentage of its margin in funding alone over a matter of days, entirely independent of price movement. That drag turns marginally profitable trades into losing ones, and it grinds down the margin buffer that protects against liquidation.
The key insight is that funding rate spikes and uniform cohort long bias are two readings of the same underlying condition. When our data shows all 16 cohorts leaning long and the funding rate is elevated, the picture is unambiguous: the market is crowded, the carrying cost is high, and the risk of a forced deleveraging event rises with every hour the crowding persists.
Hyperliquid settles funding hourly. On exchanges with 8-hour funding periods, a crowded position gets three windows per day. On Hyperliquid, it gets twenty-four. The same level of crowding costs three times as much funding drag over the same calendar period, which compresses the timeline between "crowded but holding" and "crowded and liquidating."
Reading the Divergence: Profitable vs. Unprofitable Cohorts
The most actionable signal in cohort positioning data isn't the absolute direction of any single cohort. It's the divergence between the profitable and unprofitable groups.
Consider two scenarios. In the first, all 16 cohorts are moderately long. Funding is positive but not extreme. Open interest is rising at a normal pace. This is a trend with broad participation, and while it could reverse, the crowding isn't acute enough to create cascade risk. The trade is popular, but it's not yet fragile.
In the second scenario, the same 16 cohorts are all long, but the composition has changed. The Money Printer cohort has started reducing its long exposure. The Smart Money cohort has gone from strong long to neutral. Meanwhile, the Exit Liquidity, Semi-Rekt, and Full Rekt cohorts are more aggressively long than before, adding to positions that the profitable cohorts are quietly exiting. Funding is elevated. Open interest is still climbing, but the new capital entering is predominantly from the lower PnL tiers.
That second scenario is the crowded trade at its most dangerous. The wallets with the best track records are stepping aside. The wallets with the worst track records are providing the marginal bid. When the marginal buyer is the historically unprofitable cohort, the trade's ceiling is defined by how much more capital that group is willing to commit before the music stops.
What to monitor
- Money Printer and Smart Money bias: Are the top PnL cohorts reducing, holding, or adding? Reduction alongside retail addition is the divergence signal.
- Shrimp and Fish leverage: The smallest size cohorts tend to run higher leverage. When they are heavily long, the liquidation cluster closest to spot price is dense.
- Whale and Leviathan positioning: Large accounts move markets. If they start reducing while smaller accounts add, the exit door narrows.
- Cross-cohort uniformity: The more cohorts that agree directionally, the more crowded the trade. Mixed positioning across cohorts suggests a healthier, more balanced market.
Putting It Together: A Cohort Positioning Workflow
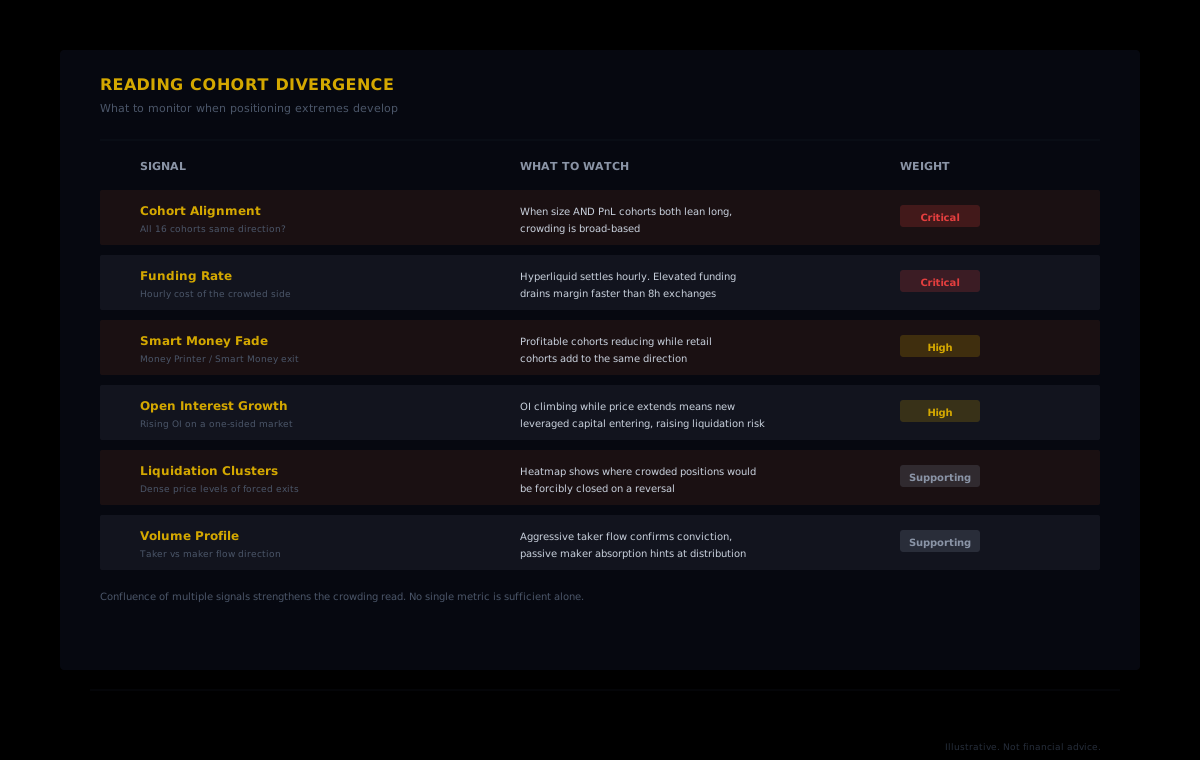
Reading crowded trades from cohort data isn't about finding a magic threshold where a number turns red. It's about recognizing a pattern across multiple signals that, taken together, describe a market that is more fragile than its price chart suggests. Here is a practical workflow.
Step 1: Check cohort alignment. Pull positioning data across all 16 cohorts for the asset you're watching. If every size cohort and every PnL cohort lean the same direction, crowding is present. Mixed positioning, where some cohorts are long and others short, suggests a healthier two-sided market.
Step 2: Overlay funding. Check the current hourly funding rate. If it's elevated, the market is confirming the crowding. The crowded side is paying a premium to maintain its position. The longer funding stays high, the more margin erodes for leveraged positions on the crowded side.
Step 3: Look for the divergence. Compare the Money Printer and Smart Money cohorts against the Exit Liquidity, Semi-Rekt, and Full Rekt cohorts. If the profitable groups are fading while the unprofitable groups are adding, the divergence is active. This is the highest-conviction input in the workflow.
Step 4: Check open interest trajectory. Rising OI alongside extreme cohort alignment means new leveraged capital is entering a crowded trade, expanding the liquidation surface. Flat or declining OI with the same positioning suggests the crowding is stable but not accelerating.
Step 5: Scan the heatmap. HyperTracker's heatmap shows where liquidation clusters sit relative to current price. When the crowded side has dense liquidation clusters close to spot, the cascade risk is higher because smaller adverse moves will trigger forced closures.
What Crowding Does Not Tell You
Cohort positioning extremes are a condition, not a timing signal. A crowded long can get more crowded. Price can keep rising for days after every cohort aligns, because momentum is self-reinforcing until it isn't. The divergence signal tells you the risk is elevated, but it doesn't tell you when the reversal starts.
This distinction matters because acting on crowding alone, without a price trigger, means fading a trend that might still have fuel. The most effective use of cohort positioning data is as a risk filter. When crowding is extreme and divergence is active, reduce size. Tighten stops. Avoid adding to the crowded side. Let the price action tell you when the turn happens. Let the positioning data tell you how violent the turn could be.
Crowded positioning also doesn't guarantee a cascade. Sometimes the market deleverages gently, with funding gradually declining as positions are closed voluntarily rather than forcibly. The cascade scenario requires a catalyst, and catalysts are unpredictable by definition. What cohort data tells you is whether the preconditions for a cascade are present. Whether the catalyst arrives is a separate question.
See Which Side of the Trade Each Cohort Is On
HyperTracker tracks live positioning across all 16 behavioral cohorts on Hyperliquid. Spot crowded trades, track smart money divergence, and monitor liquidation clusters before the unwind starts.
The Market Remembers Every Crowded Trade
The most expensive lesson in leveraged trading is learning what a crowded trade feels like from the inside. It feels like conviction. It feels like the market agreeing with you. It feels like safety in numbers. Every cohort is long. Funding is positive but manageable. Open interest is climbing. Price is going up. Everything confirms the thesis.
Then the profitable cohorts start leaving. You might not notice, because your position is still green and the price chart still looks bullish. But underneath the chart, the composition of the market has changed. The wallets that are best at this game are stepping out. The wallets that lose the most money are stepping in. And when the music stops, the crowd discovers that consensus was the risk, and the exit was always going to be too small for everyone to fit through at once.
Cohort positioning data won't tell you the exact moment the turn happens. It will tell you when the preconditions are stacked against you. On a market like Hyperliquid, where hourly funding and continuous liquidation engines compress the timeline between crowding and cascade, seeing that setup early is the edge.