
When Funding Spikes, Cohorts Split: Reading Extremes on Hyperliquid
By CMM Team - 28-Jul-2026
When Funding Spikes, Cohorts Split: Reading Extremes on Hyperliquid
Funding rates spike, and most traders see a single number. Positive means longs are crowded, negative means shorts. Simple enough. But that surface read hides the real story, because behind that single number, different groups of traders are doing completely different things. The wallets with the best all-time track records are usually moving one way while the wallets with the worst records are moving the other. The funding rate tells you the market is leaning. The cohort split tells you who is going to be right.
On Hyperliquid, where funding settles every hour and the entire venue is on-chain, that split is visible in real time. You can see which behavioral segments are adding to the crowded side and which are quietly fading it. That divergence between cohorts during funding extremes is one of the most useful signals a trader or builder can track, because it tends to resolve in favor of the historically profitable side.
This article breaks down what funding extremes actually look like on Hyperliquid, why different cohorts respond to the same funding event in opposite directions, and how to combine funding rate data with cohort positioning through our API to get ahead of the resolution.
What makes a funding rate "extreme"
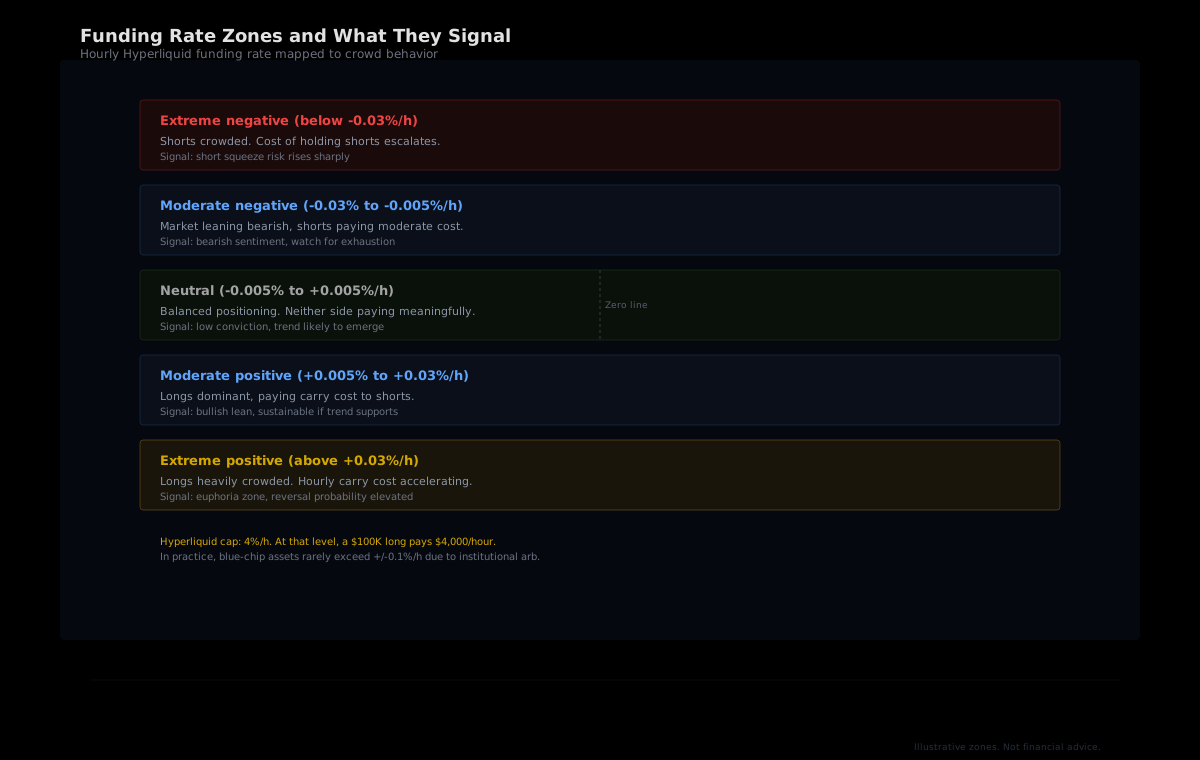
Hyperliquid calculates funding using the formula F = Average Premium Index (P) + clamp(interest rate - P, -0.0005, 0.0005), with a hard cap at 4% per hour. The interest rate component sits at a fixed 0.01% per 8 hours (roughly 11.6% APR annualized, paid to shorts). Under normal conditions, funding on a blue-chip pair like BTC or ETH hovers close to the baseline, moving slightly positive or negative as positioning tilts.
An "extreme" isn't a fixed number. Context matters. On BTC, a sustained +0.03% per hour is notable because institutional arbitrage capital normally compresses the premium within minutes. On a freshly listed long-tail asset with thin liquidity, +0.1% per hour can persist for days because there isn't enough arbitrage capital to close the gap. The question isn't whether the absolute number looks big. The question is whether the rate has moved far enough from baseline that holding the crowded side starts costing real money, fast enough to change behavior.
A useful framing: when the hourly cost of carry starts eating into expected trade PnL within a single day, the funding rate has crossed into "extreme" territory for that asset. At +0.05% per hour on a $50,000 notional position, the funding bill is $25 per hour, which is $600 per day. That math changes behavior, and the behavioral changes show up in cohort data.
The cohort split: why it matters
HyperTracker classifies every wallet on Hyperliquid into one of 16 behavioral cohorts: 8 based on account equity (Shrimp through Leviathan) and 8 based on all-time PnL (Money Printer through Giga-Rekt). The PnL cohorts are especially revealing during funding extremes because they sort traders by historical performance, which turns out to be a strong predictor of how they respond to positioning stress.
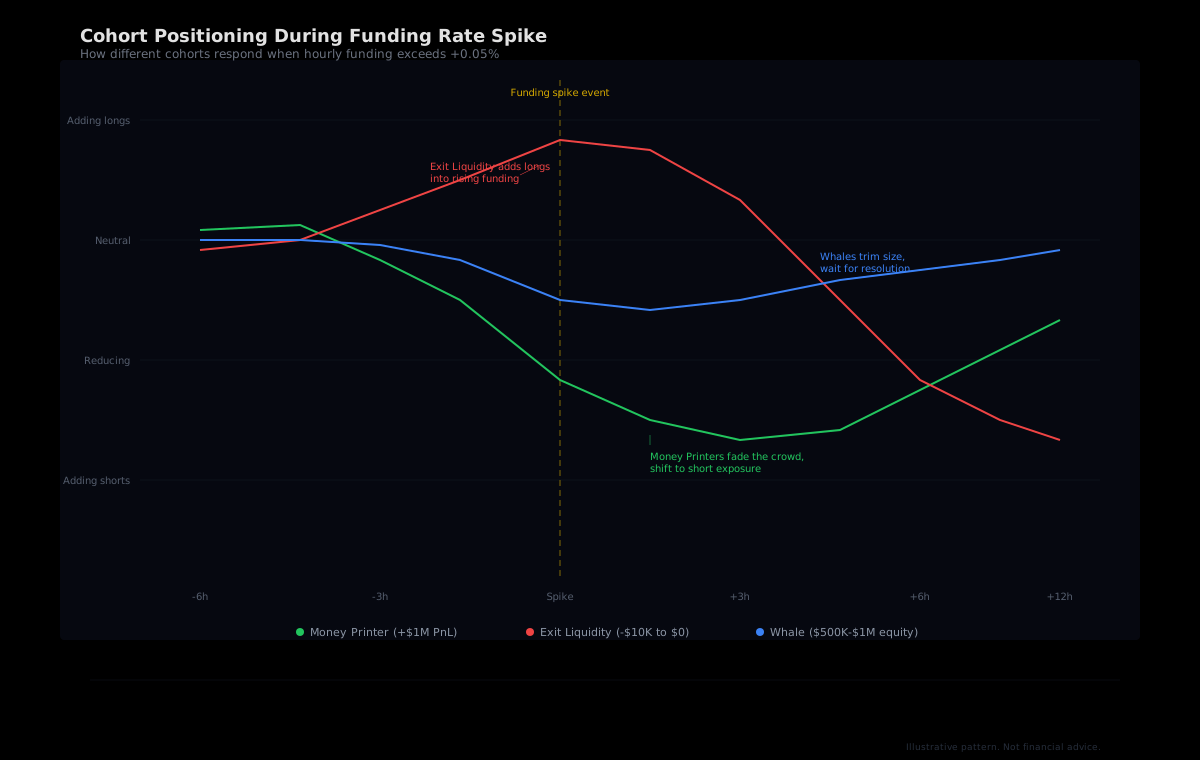
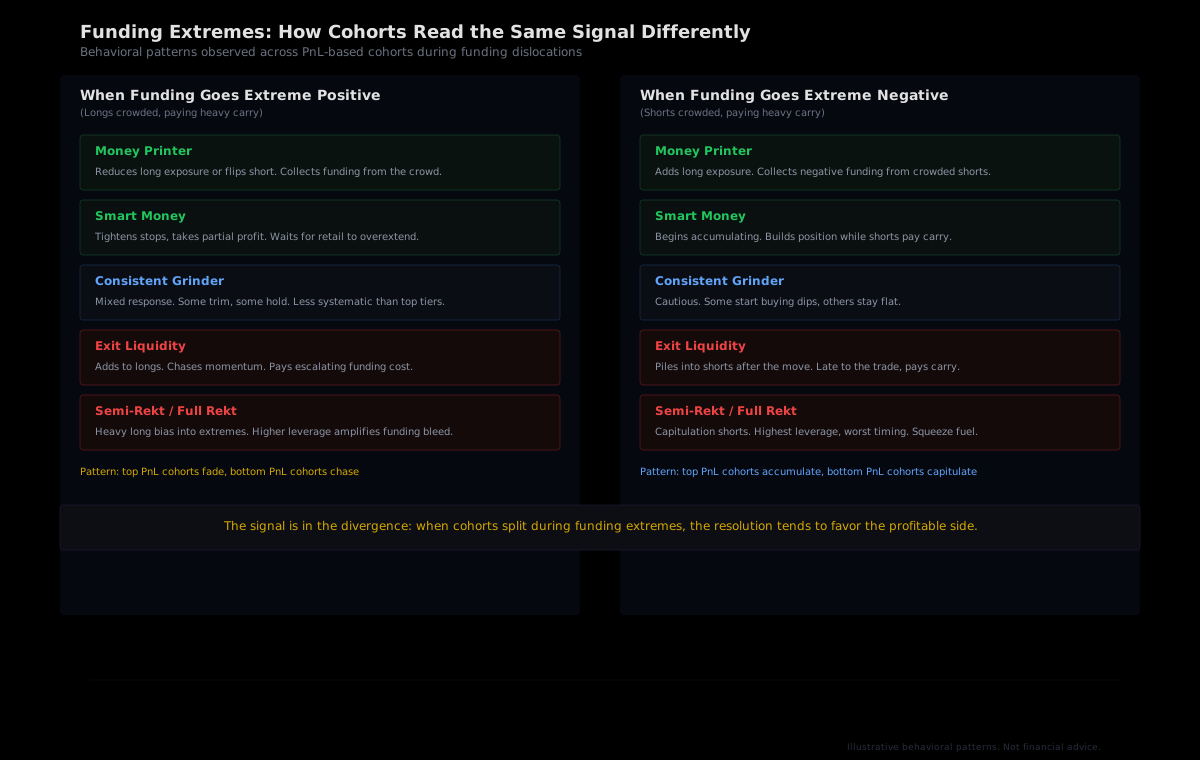
During a positive funding spike (longs crowded, paying heavy carry), the typical pattern looks like this:
- Money Printer (all-time PnL above +$1M): Reduces long exposure or flips net short. These wallets have survived enough cycles to recognize that extreme positive funding is a crowding signal, and they move to collect carry from the other side of the trade.
- Smart Money (+$100K to +$1M PnL): Tightens stops and takes partial profit. Doesn't necessarily flip, but de-risks systematically.
- Consistent Grinder (+$10K to +$100K PnL): Mixed response. Some trim, some hold. Less systematic than the top tiers but generally aware of the risk.
- Exit Liquidity (-$10K to $0 PnL): Adds to longs. These wallets tend to chase the momentum that created the spike in the first place, paying escalating carry costs without adjusting for it.
- Semi-Rekt and Full Rekt (PnL below -$10K): Heavy long bias into extremes, often with higher effective leverage. The funding bleed compounds their drawdown.
The mirror pattern appears during negative funding spikes (shorts crowded): Money Printers accumulate long exposure, collecting carry from the short side, while the negative-PnL cohorts pile into late shorts and become squeeze fuel.
The signal is the divergence itself. When every cohort is positioned the same way, funding extremes are just a consensus tax. When cohorts split, with profitable wallets moving against the crowd while unprofitable wallets double down, the resolution has historically favored the profitable side.
Why the split happens
The behavioral divergence isn't random. It comes down to three structural differences between the top and bottom PnL cohorts.
Carry awareness
Traders who have made money over the long run tend to internalize carry cost as part of their position sizing. When funding climbs, the expected value of maintaining the position shifts because the carry eats into the edge. Money Printers and Smart Money wallets adjust position size or direction to account for this. Negative-PnL cohorts often treat funding as a background cost and focus on price direction alone, which means they keep adding to a position that is costing more to hold every hour.
Leverage discipline
Accounts in the Exit Liquidity, Semi-Rekt, and Full Rekt cohorts tend to use higher effective leverage. That's partly why their PnL is negative: they sized too large, got stopped out or liquidated repeatedly, and the losses compounded. During a funding extreme, higher leverage amplifies the carry cost relative to margin. A 10x leveraged position pays 10x the funding burden relative to its collateral. Top-PnL cohorts typically run lower leverage, so the same funding spike costs them proportionally less and gives them more time to make a decision.
Timing and conviction signals
Profitable wallets tend to move early in a funding shift. They start trimming or repositioning before funding hits its peak, because they read the premium compression and open interest changes that precede the headline rate. By the time funding is visibly extreme, the Money Printers have already adjusted. The negative-PnL cohorts are the ones still entering, reacting to the price move that caused the funding spike rather than the funding itself. They're trading what already happened. The profitable wallets are trading what's likely to happen next.
Reading the signal in practice
Funding alone is a one-dimensional signal: it tells you the direction of the lean and how expensive it is. Adding cohort data makes it two-dimensional: you can see who is on each side. That second dimension is what separates a "crowded but sustainable" environment from a "crowded and about to snap" one.
A few patterns worth tracking:
Funding extreme with cohort divergence
Funding is spiking positive. Money Printer and Smart Money cohorts are flat or net short. Exit Liquidity and Semi-Rekt cohorts are net long. This is the classic crowded-and-fragile setup. The wallets with the best long-term records are positioned for a reversal, and the wallets funding the crowded side have historically poor performance. Until the profitable cohorts rejoin the long side, the long trade is structurally weak.
Funding extreme without cohort divergence
Funding is elevated, but all cohorts are leaning the same way. This reads differently. If Money Printers are still long alongside Exit Liquidity, the directional conviction is broad-based and the funding extreme might be sustainable for longer. High funding alone isn't enough to call a reversal. You need the split.
Cohort divergence without funding extreme
Money Printers are quietly shifting long while funding is neutral. This is a lower-conviction signal, but it's worth noting: when the profitable cohorts move before funding reflects it, they're often positioning ahead of a catalyst that hasn't priced in yet. The funding print will follow if they're right.
Using the HyperTracker API to track funding-cohort divergence
HyperTracker's API exposes cohort-level positioning data across all 16 segments. To track funding-cohort divergence, you'd combine two data streams: the funding rate (available from Hyperliquid's native API or any aggregator) and cohort positioning from HyperTracker.
A basic approach:
- Monitor funding rates on your target asset. Flag when the rate crosses a threshold you define (relative to that asset's recent baseline, not an absolute number).
- Pull cohort positioning from the
/cohorts/metricsendpoint, filtering by PnL-based segments. Compare the directional lean of Money Printer (cohort id 8) and Smart Money (cohort id 9) against Exit Liquidity (id 12), Semi-Rekt (id 13), and Full Rekt (id 14). - Score the divergence. If the top-PnL cohorts are positioned opposite to the bottom-PnL cohorts, the divergence is present. The wider the gap in directional lean, the stronger the signal.
- Track resolution. Log the state when divergence triggers and measure which side was correct over the following hours and days. This builds your own backtesting dataset for the signal.
The API refreshes cohort data every 5 minutes, which is frequent enough to catch positioning shifts during funding spikes. You can set up webhook alerts at the Flow tier ($799/mo) or higher to get push notifications when cohort positioning changes beyond a threshold you define, so you don't have to poll continuously.
# Example: compare Money Printer vs Exit Liquidity directional lean
# Cohort IDs: Money Printer = 8, Exit Liquidity = 12
money_printer = get_cohort_metrics(coin="BTC", cohort_id=8)
exit_liquidity = get_cohort_metrics(coin="BTC", cohort_id=12)

mp_bias = money_printer["longOiShare"] - money_printer["shortOiShare"]
el_bias = exit_liquidity["longOiShare"] - exit_liquidity["shortOiShare"]

divergence_score = mp_bias - el_bias
# Negative score = MP leaning short while EL leaning long (bearish signal)
# Positive score = MP leaning long while EL leaning short (bullish signal)
This is a starting framework. Builders running more sophisticated setups could weight the divergence by cohort size (Leviathans vs Shrimp carry different market impact), layer in open interest changes to confirm whether the positioning is growing or shrinking, or combine with liquidation risk data from our /liquidation-risk endpoint to identify where forced unwinds might accelerate the resolution.
What the divergence doesn't tell you
Cohort-funding divergence is a positioning signal, and positioning signals have limits. A few things to keep in mind:
- Timing is imprecise. The signal tells you who is on which side, and it tells you that historically the profitable side wins more often. It does not tell you when the reversal happens. Extreme funding can persist for hours or even days before resolving, especially on lower-liquidity assets.
- Macro can override positioning. A CPI print, an exchange hack, or a protocol exploit can move the market regardless of which cohorts are positioned where. Cohort data tells you how the venue is leaning. It doesn't tell you what the next headline will be.
- Cohort data reflects Hyperliquid only. The same traders might have hedging positions on Binance, OKX, or in spot markets that our data doesn't capture. A Money Printer who looks net short on Hyperliquid might be net long across their full book. The cohort signal is strongest when Hyperliquid is the dominant venue for that asset's derivative flow.
- This is not a standalone trading system. Use cohort-funding divergence as one input alongside price action, open interest trends, and your own analysis. Treating any single signal as a complete strategy is how Exit Liquidity wallets got their name.
Track Cohort Positioning in Real Time
HyperTracker's API gives you cohort-level positioning data across all 16 behavioral segments on Hyperliquid. See where Money Printers and Smart Money wallets are leaning, and build funding-cohort divergence signals into your trading stack. The free tier includes 100 requests per day to get started.
The meta-lesson from funding extremes
Every funding spike is a stress test. The rate itself just measures how crowded one side of the trade has gotten. But the way different wallets respond to that crowding, whether they lean in or pull back, compound or de-risk, is a behavioral fingerprint that the historical PnL data has already scored for you.
The wallets that consistently make money over thousands of trades tend to treat extreme funding as information: a signal to adjust positioning before the crowd realizes the carry is unsustainable. The wallets that consistently lose tend to treat the same conditions as momentum confirmation: a reason to add. One group is reading the cost. The other is reading the price. When they split, pay attention to the group that's been right before.
That's the whole pitch for combining funding data with cohort intelligence. The funding rate tells you the market is stretched. Our data tells you who is stretching it and who is already reaching for the exit.