
Who's Actually Selling at Bitcoin's $83K Wall (And Who's Loading)
By CMM Team - 07-Sep-2026
Who's Actually Selling at Bitcoin's $83K Wall (And Who's Loading)
Bitcoin has tapped $83,000 three times in the past two weeks and gotten rejected every time. The aggregate Glassnode Accumulation Trend Score just dropped to 0.37, which puts the entire market in distribution territory for the first time since early June.
That number on its own tells you the market is selling. But it does not tell you who is selling, how aggressively, or whether the behavior is uniform across wallet sizes. And that distinction matters, because sell walls resolve differently depending on who is standing behind them. When retail sells and whales buy, the wall usually breaks. When whales sell and retail buys, the wall usually holds, and the buyers become the liquidity that funds the next leg down.
Cohort-level data separates the useful signal from the aggregate noise. Instead of asking "is the market selling?" you ask "which segments of the market are selling, and does their historical profitability give the signal weight?" That is how you read a sell wall rather than just see one.
The $83K sell wall in context
The resistance between $83,000 and $86,000 is not a random round-number barrier. Glassnode identifies it as a dense cluster of long-term holder supply, wallets that have held for six months or longer and are now positioned near breakeven at roughly $83,000. These holders watched their positions go underwater during the summer correction and are now seeing a chance to exit flat. That motivation creates steady selling pressure that doesn't disappear after a single attempt, because fresh supply keeps arriving as BTC approaches the zone.
Below current prices, the 50-week EMA sits at approximately $77,353, which is acting as the floor this range has defended. The short-term holder cost basis sits further down, around $71,000, and a dense accumulation zone between $62,000 and $65,000 provides deep support if the 50-week EMA breaks.
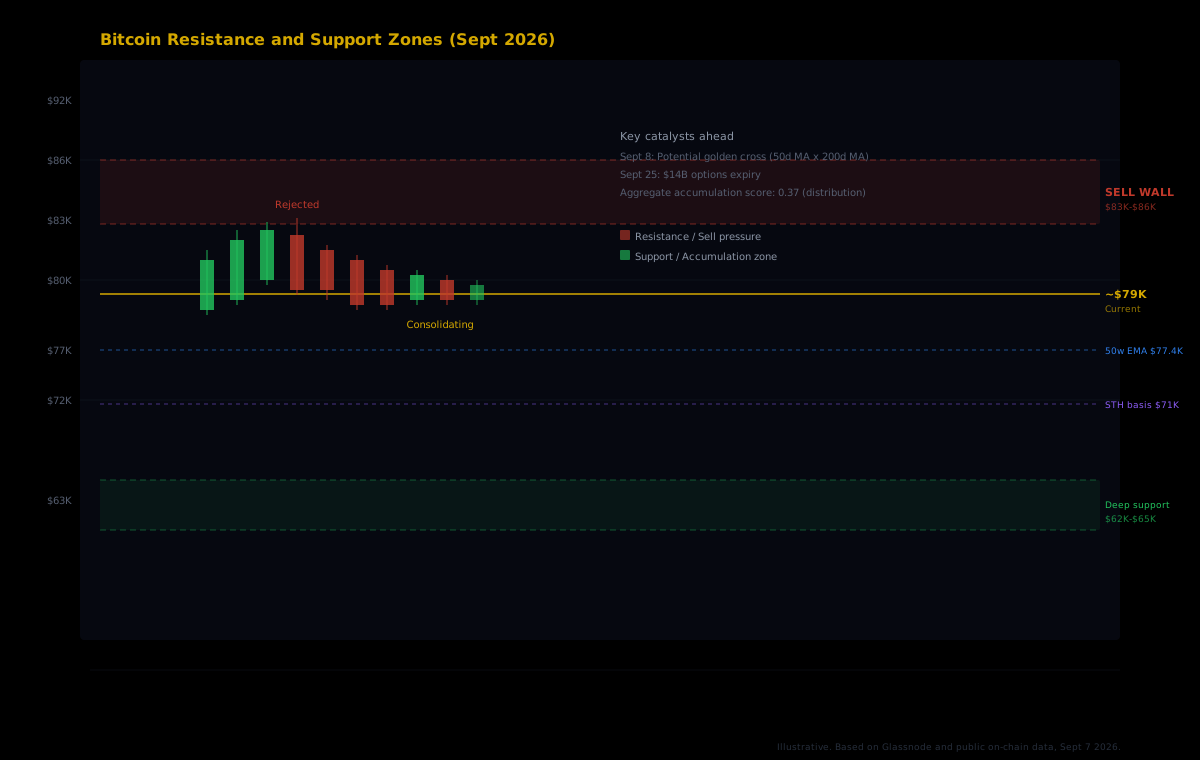
Two catalysts sit on the calendar. A potential golden cross, where Bitcoin's 50-day moving average crosses above the 200-day, could form as early as September 8. And a roughly $14 billion options expiry on September 25 could force directional resolution. Whether that resolution is up through the wall or down through the floor depends on which side of the trade controls the flow.
The aggregate score hides the real divergence
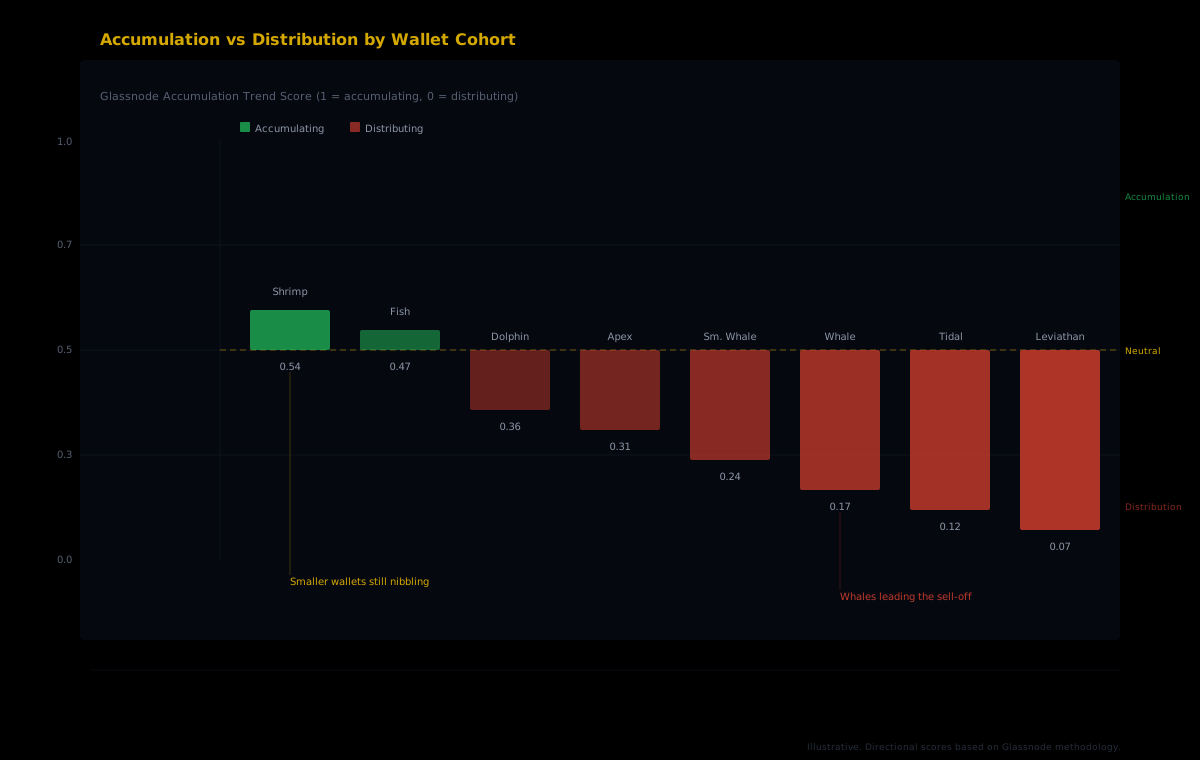
The 0.37 accumulation trend score is a single number that compresses wildly different behaviors into one metric. A score of 1 signals strong accumulation across all wallet sizes. A score of 0 signals heavy distribution. At 0.37, the market is distributing, but the breakdown by wallet size tells a more complicated story.
Whale-sized wallets, holders with 1,000 or more BTC, are leading the exit. Their distribution intensity is the heaviest of any cohort. This is significant because whales moving first has historically preceded extended range-bound markets or corrections, while retail-led selling tends to mark capitulation bottoms.
Meanwhile, smaller wallets are still accumulating, though at a declining rate. The divergence between large and small wallets is where the signal lives. When the biggest players sell and the smallest players buy, the big players are typically right, because they have more resources to analyze positioning and more capital to move price.
Reading the divergence through cohort data
Glassnode's accumulation trend score groups wallets by BTC holdings. HyperTracker's 16 cohorts on Hyperliquid do something conceptually similar but purpose-built for perps: classifying every wallet by both account size and all-time PnL. The size cohorts range from Shrimp ($0 to $250 in perp equity) up to Leviathan ($5M+), while the PnL cohorts range from Money Printer ($1M+ in cumulative profit) down to Giga-Rekt (below -$1M in cumulative losses).
Why does that second dimension matter? Because a wallet with $500K in perp equity and $2M in all-time profits behaves very differently at a sell wall than a wallet with $500K in perp equity and -$300K in all-time losses. The first wallet can afford to reduce exposure tactically. The second wallet may be forced to close positions to manage margin. Same size, completely different behavior, and completely different signal value.
Size cohorts: large wallets reducing, small wallets buying
The pattern on Hyperliquid mirrors what Glassnode sees on-chain: larger wallets are reducing exposure while smaller wallets keep buying. Whale and Leviathan cohorts have been net reducing their long positioning, cutting leverage and trimming notional. Shrimp and Fish cohorts are still opening new longs on each bounce toward $80K.
This is classic late-rally behavior. Smaller participants see the price near recent highs and anchor on the upside scenario. Larger participants see the same price and anchor on the risk of rejection, because they have been through enough cycles to recognize a sell wall backed by motivated holders.
PnL cohorts: profitable wallets de-risking at resistance
The PnL dimension adds another layer. Money Printer wallets, those with $1M+ in cumulative profit, tend to de-risk ahead of contested resistance zones. They have profits to protect, so their natural response to a sell wall is to reduce positions or hedge. Smart Money wallets ($100K to $1M in all-time profit) show a similar but less aggressive pattern: smaller reductions, more selective hedging.
Consistent Grinders ($10K to $100K profit) behave more like the retail size cohorts: still buying, still adding to positions, still anchored on the upside scenario. And the negative-PnL cohorts, Exit Liquidity through Giga-Rekt, often add exposure at the worst moments because they are chasing breakeven, which makes them the last participants to exit a failing rally.
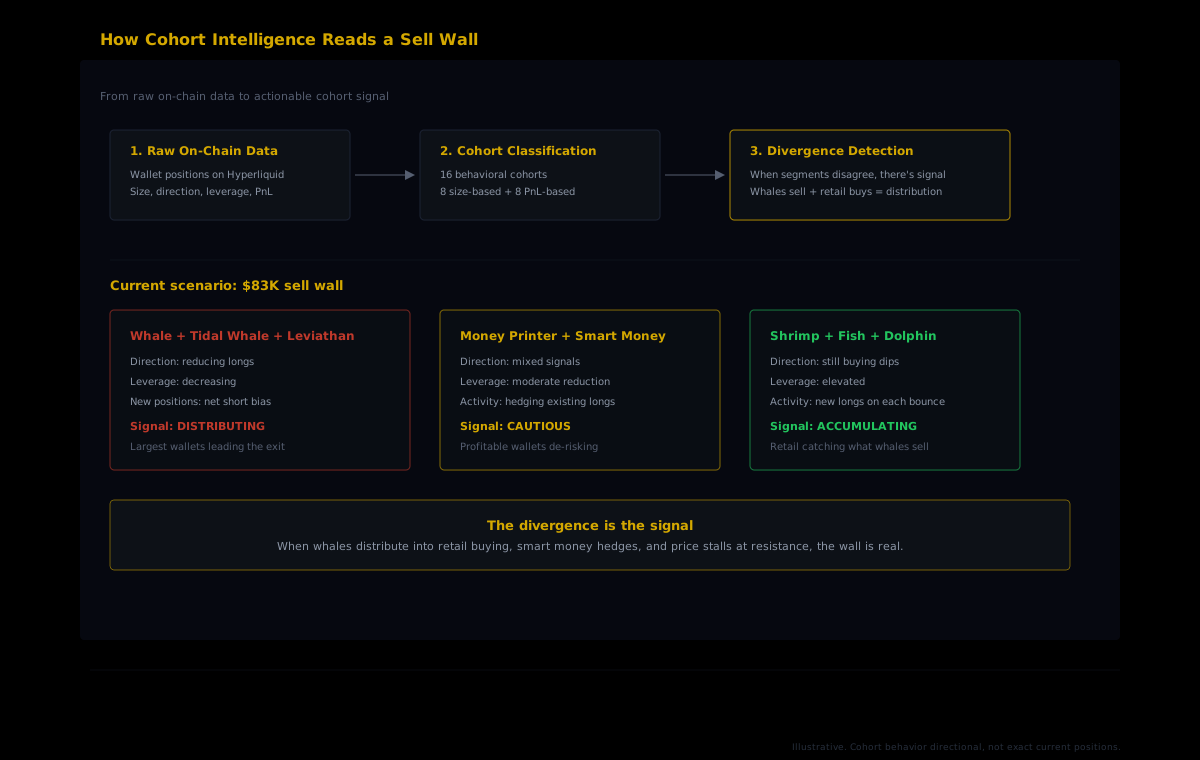
The signal from cohort divergence: When the most profitable wallets reduce exposure and the least profitable wallets increase it, that is the market distributing from strong hands to weak hands. The sell wall becomes a transfer mechanism, moving risk from wallets that can absorb it to wallets that cannot.
How to use cohort data at a sell wall
Knowing that whales are distributing is useful context, but context alone does not produce tradeable decisions. Here is how to turn cohort divergence data into a structured read of the $83K sell wall.
Step 1: Check the direction of the largest cohorts
Pull positioning data for the Whale, Tidal Whale, and Leviathan cohorts. Are they adding longs, reducing longs, or flipping short? If all three are reducing, the weight of money is on the sell side. If one or two are adding while the others reduce, the signal is mixed and the wall may be weaker than it looks.
Step 2: Cross-reference with PnL cohorts
Check what the Money Printer and Smart Money cohorts are doing. These wallets have demonstrated sustained profitability, so their positioning carries more predictive weight than their size alone would suggest. If Money Printers are reducing while Giga-Rekts are adding, the divergence confirms distribution from strong to weak hands.
Step 3: Watch for the flip
Sell walls break when the selling pressure exhausts itself, and you can see that in cohort data before it shows in price. The signal is large cohorts stopping their reductions and beginning to re-accumulate, even while price is still below the wall. When Money Printers start adding longs near the current range instead of trimming closer to resistance, the market's read on the wall has changed.
Why aggregate metrics mislead at turning points
The Bitcoin market generates dozens of aggregate metrics: total open interest, combined funding rates, net exchange flows, total long/short ratios. Each of these compresses the behavior of hundreds of thousands of wallets into a single number, and each loses the distributional information that matters most at inflection points.
Open interest rising tells you positions are being opened. It does not tell you whether the new positions are from profitable whales adding to conviction longs or from underwater retail doubling down. Funding rates turning positive tells you longs are paying shorts. It does not tell you whether the longs are concentrated in Leviathans or spread across Shrimp. These differences matter because the same aggregate number can produce opposite outcomes depending on who is behind it.
Cohort-level analytics decompose the aggregate into its components. Instead of "OI is up," you get "Leviathan OI is flat while Shrimp OI spiked," which is a completely different market structure with a completely different probable outcome.
The $83K playbook: what happens next
Based on the current cohort structure, three scenarios are in play.
Scenario 1: Wall holds, extended range. If whale and Money Printer cohorts continue distributing and retail continues buying, the sell wall absorbs the buying pressure without breaking. BTC consolidates between the 50-week EMA (~$77K) and $83K until one side exhausts its capital. This is the highest-probability outcome when distribution flows from strong to weak hands.
Scenario 2: Wall breaks on volume. If a catalyst, such as the golden cross forming or unexpectedly bullish options positioning ahead of the September 25 expiry, triggers a surge in whale buying, the sell wall can be absorbed in a single session. The tell in cohort data is Leviathan and Tidal Whale cohorts flipping from net reducing to net adding within a short window. That has not happened yet.
Scenario 3: Wall holds, support breaks. If distribution intensifies and retail buying dries up, BTC loses the 50-week EMA at $77K and retests the short-term holder cost basis near $71K. The deep support between $62K and $65K sits below that. Cohort data shows this scenario via retail cohorts flipping from accumulation to distribution, the capitulation signal.
Track cohort positioning in real time
HyperTracker's API gives you programmatic access to all 16 behavioral cohorts on Hyperliquid: 8 by account size and 8 by all-time PnL. See which segments are accumulating, which are distributing, and where the smart money is positioned. One API call, every 5 minutes.
Explore HyperTracker's Cohort API
Beyond the wall
Every sell wall eventually resolves. The question is never whether it will break, but how, and whether you are positioned on the right side of the resolution. Aggregate metrics tell you a wall exists. Cohort data tells you who built it, how motivated they are, and what it would take to clear it.
Right now, the $83K to $86K zone is defended by long-term holders near breakeven, reinforced by whale-cohort distribution, and absorbed by retail and lower-PnL wallets buying dips. That structure favors the sellers until something changes in the composition of the flow. Watch for Money Printers to stop trimming. Watch for Leviathans to start adding. And if those signals arrive before the September 25 options expiry, the wall's days are numbered.
Until then, the wall is real, and the cohort data explains exactly why.