
Who's Holding the Biggest Positions on Hyperliquid Right Now?
By CMM Team - 10-Oct-2026
Who's Holding the Biggest Positions on Hyperliquid Right Now?
Somewhere on Hyperliquid, right now, someone is holding a $30 million BTC short. Someone else has two $30 million ETH longs open at the same time. And a third trader is sitting on an $18 million HYPE short with a track record that should make anyone nervous. These positions move markets when they close, and most traders never see them coming because they never look.
The biggest open positions on Hyperliquid are public. Every one of them sits on-chain, visible to anyone who knows where to query. But raw chain data does not tell you who holds the position, how close it is to liquidation, or whether the trader behind it has ever been profitable. That context is the difference between a signal and noise. This article walks through a daily routine for finding the largest positions, checking the five fields that matter on each one, and pulling the data programmatically when you want to automate it.
Where the biggest positions live
The fastest path to the current biggest positions is the HyperTracker Leaderboards page. The 24-hour tile shows each position's coin, side, notional value, age, and a "new" flag for positions opened in the current window. Sort by notional and the largest positions float to the top.
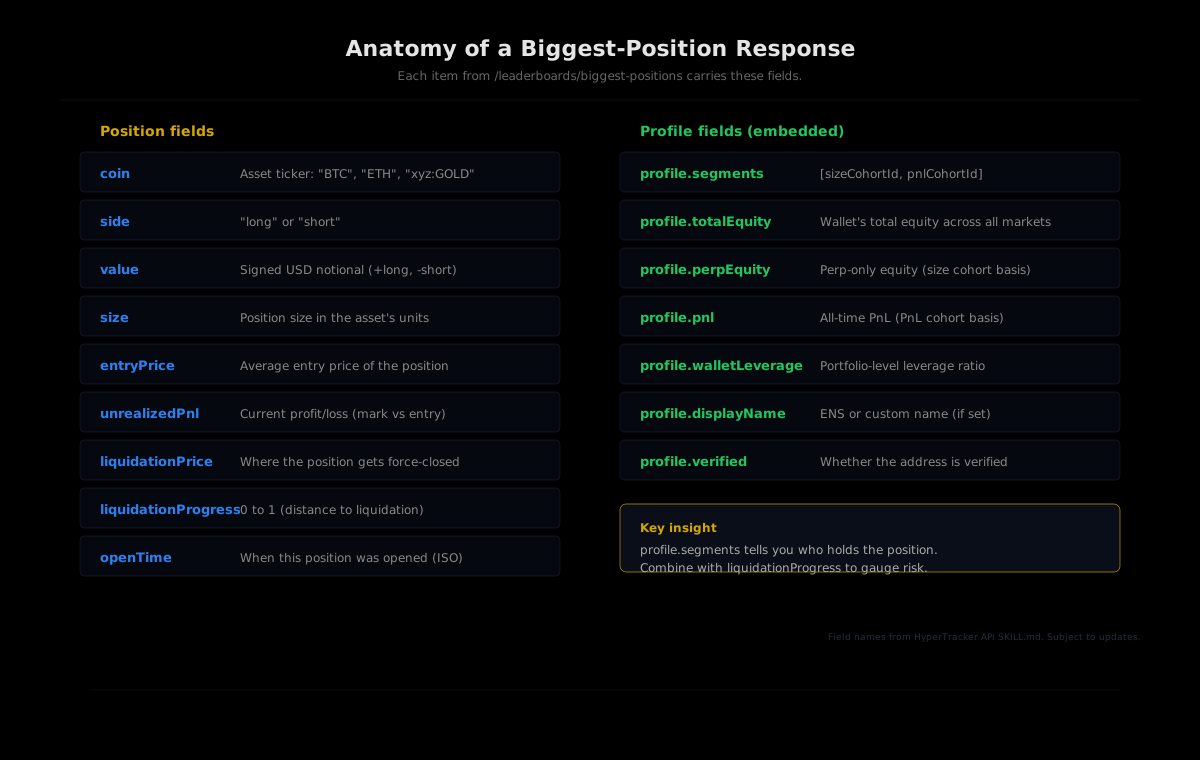
For builders, the same data is available via the API: GET /leaderboards/biggest-positions. The endpoint ranks every open perp position on Hyperliquid by absolute USD notional. A $33 million short ranks above a $30 million long because the sort uses absolute value regardless of direction. The response includes position details, liquidation metrics, and a full trader profile with cohort segment IDs.
Quick reference: The endpoint accepts
offset,limit(1 to 100), andopenedWithin(24h,7d,30d,all). Default limit is 100. UseopenedWithin=24hto filter for freshly opened positions only.
Five fields to check on every position
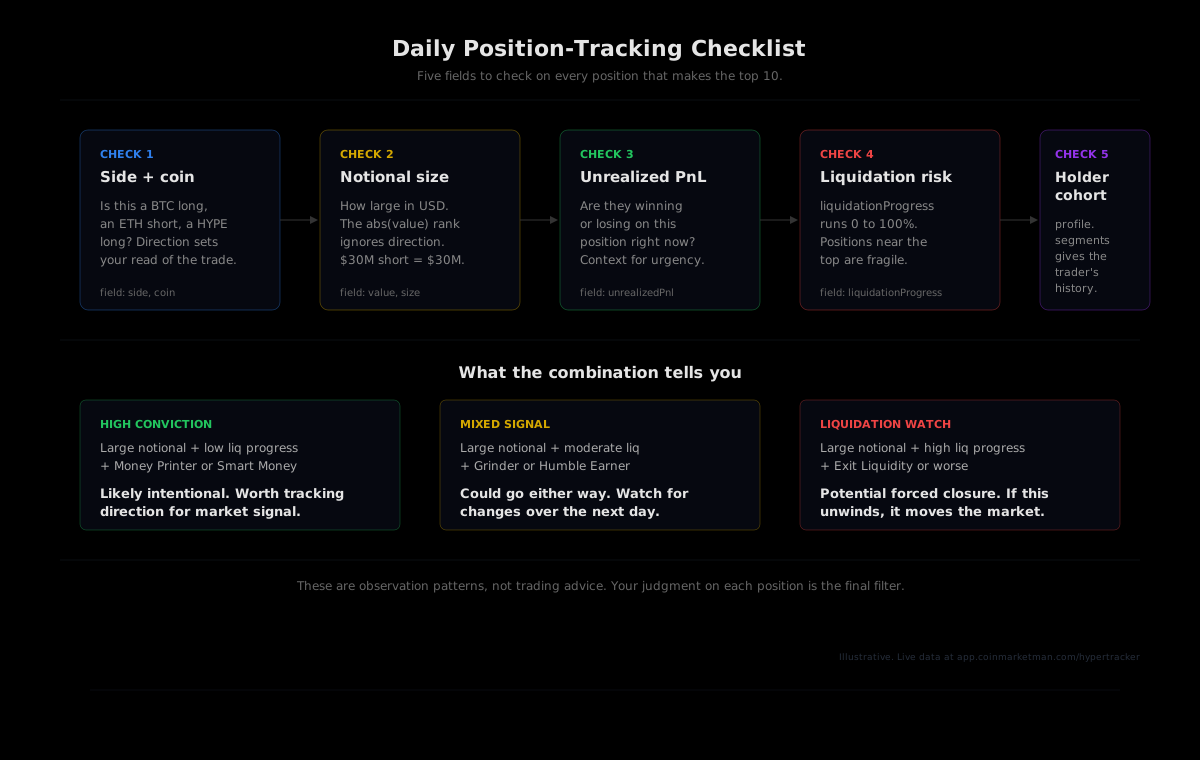
Pulling a list of large positions is step one. Making sense of each position requires checking five fields, every time, in a consistent order. Skip any one of them and you are trading on incomplete context.
1. Side and coin
This sounds obvious, but it sets the frame for everything else. A $30 million BTC long tells a different story than a $30 million BTC short, and both tell a different story than a $30 million HYPE long. The side field returns "long" or "short". The coin field returns the ticker: "BTC", "ETH", "SOL", or HIP-3 assets like "xyz:GOLD".
2. Notional size
The value field is signed: positive for longs, negative for shorts. The leaderboard sorts by absolute value, so a -$33M short outranks a +$30M long. The size field gives you the position in the asset's own units (how many BTC, how many ETH), which matters when you want to reason about the position relative to the asset's daily volume.
3. Unrealized PnL
Is this position currently winning or bleeding? The unrealizedPnl field is the mark-to-market profit or loss at the time of the last state update. A position that is deeply underwater behaves differently than one that is sitting on eight figures of profit. Losing positions create urgency. Winning positions create optionality. The unrealized PnL tells you which mood the holder is probably in.
4. Liquidation distance
The liquidationProgress field runs from 0 to 1 (or 0% to 100%). A position at 15% has plenty of room. A position at 60% is getting uncomfortable. A position at 85% is one bad candle from forced closure, and if it is large enough, the liquidation itself will push price further in the same direction. This is the field that turns position-watching from curiosity into actionable intelligence.
5. Holder cohort
This is the field that only HyperTracker provides. The profile.segments array on each position returns two segment IDs: one for the holder's size cohort (by perp equity) and one for their PnL cohort (by all-time perp PnL). A Leviathan (over $5 million in perp equity) who is also a Money Printer (over $1 million in all-time profit) is a very different counterparty than a Small Whale who is classified as Full Rekt.
Our data classifies every active wallet on Hyperliquid into 16 behavioral cohorts across these two axes. Eight size tiers from Shrimp ($0 to $250) to Leviathan ($5M+), and eight PnL tiers from Money Printer (+$1M and up) to Giga-Rekt (below -$1M). The segment IDs come embedded in the biggest-positions response, so you do not need a separate lookup call.
Pulling the data programmatically
The dashboard is the fastest way to scan on any given morning. But if you want to run this check daily, or pipe the results into a bot, a spreadsheet, or an alerting system, you need the API call. Here is the minimum viable version:
curl -H "Authorization: Bearer $HT_TOKEN" \
  "https://ht-api.coinmarketman.com/api/external/leaderboards/biggest-positions?limit=10"
Each item in the response carries the full position record plus the embedded profile. A quick Python script that formats the top 10 into a readable table:
import requests

BASE = "https://ht-api.coinmarketman.com/api/external"
HEADERS = {"Authorization": f"Bearer {TOKEN}"}

SIZE_NAMES = {
    16: "Shrimp", 1: "Fish", 2: "Dolphin", 3: "Apex Predator",
    4: "Small Whale", 5: "Whale", 6: "Tidal Whale", 7: "Leviathan"
}
PNL_NAMES = {
    8: "Money Printer", 9: "Smart Money", 10: "Consistent Grinder",
    11: "Humble Earner", 12: "Exit Liquidity", 13: "Semi-Rekt",
    14: "Full Rekt", 15: "Giga-Rekt"
}

resp = requests.get(f"{BASE}/leaderboards/biggest-positions",
                     headers=HEADERS, params={"limit": 10})
data = resp.json()

for item in data["items"]:
    segs = item["profile"]["segments"]
    size_label = SIZE_NAMES.get(segs[0], "?")
    pnl_label  = PNL_NAMES.get(segs[1], "?")
    liq_pct    = round(item["liquidationProgress"] * 100, 1)

    print(f"{item['coin']:6s} {item['side']:5s} "
          f"${abs(item['value']):>12,.0f}  "
          f"liq:{liq_pct:5.1f}%  "
          f"{size_label} / {pnl_label}")
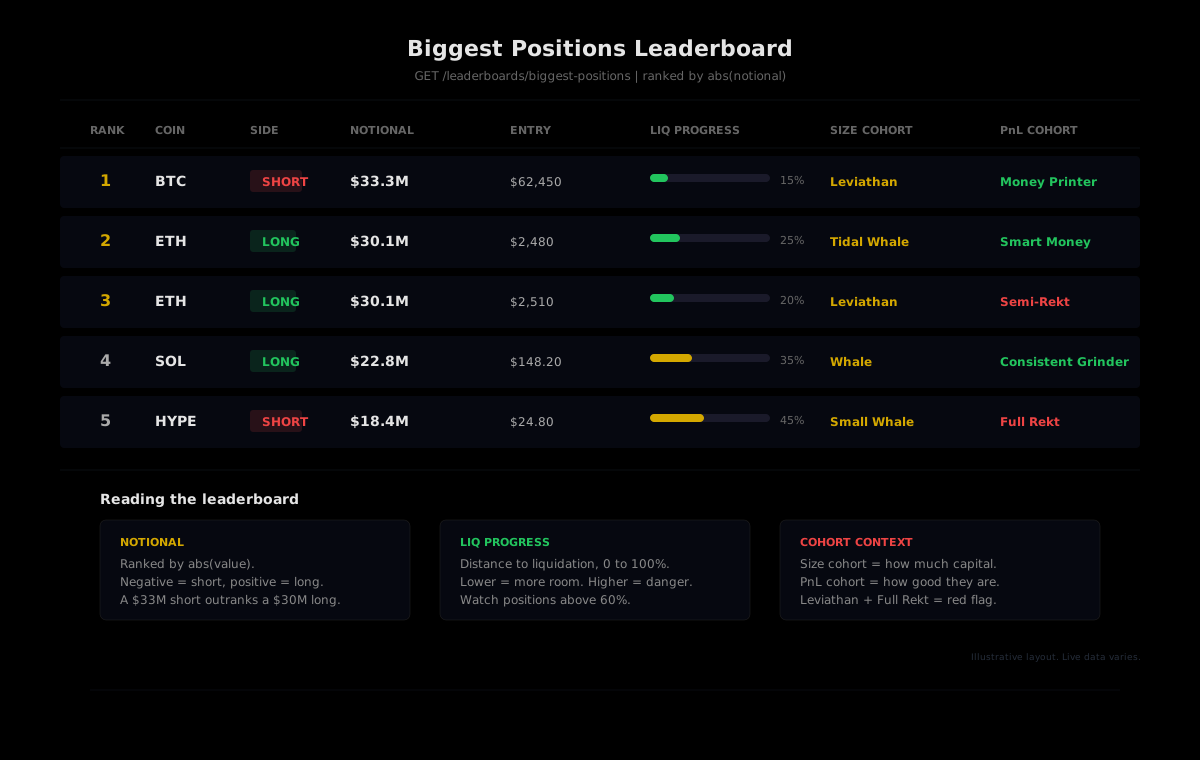
That produces output like:
BTC    short $  33,300,000  liq: 15.0%  Leviathan / Money Printer
ETH    long  $  30,100,000  liq: 25.0%  Tidal Whale / Smart Money
ETH    long  $  30,100,000  liq: 20.0%  Leviathan / Semi-Rekt
SOL    long  $  22,800,000  liq: 35.0%  Whale / Consistent Grinder
HYPE   short $  18,400,000  liq: 45.0%  Small Whale / Full Rekt
The illustrative output above uses example figures; live values change with every state update (roughly every 30 minutes).
Filtering for fresh positions
The default view returns all open positions regardless of age. A position that was opened three months ago and a position that was opened three hours ago have very different implications. The openedWithin parameter lets you filter:
openedWithin=24h: Only positions opened in the last day. These are the new bets, the fresh convictions. When a Leviathan opens a new $25 million position overnight, this is where you will see it first.openedWithin=7d: Positions from the past week. Useful for catching medium-term conviction trades that have had a few days to develop.openedWithin=30d: The past month. Broader view, but still excludes positions from the ancient history of an account's lifecycle.openedWithin=all: No filter. Every open position regardless of age. This is the default.
For a daily morning scan, openedWithin=24h is the most useful because it isolates what changed overnight. Run it alongside an unfiltered limit=5 call to see both the newest large positions and the persistent giants.
What the cohort context actually tells you
The position itself is just a number. A $30 million ETH long means one thing when it belongs to a Leviathan classified as Money Printer (the holder has over $5 million in perp equity and has made over $1 million in all-time profit). It means something entirely different when it belongs to a wallet classified as Full Rekt (all-time losses between $100K and $1M). Same position size, same coin, same direction. Completely different signal.
This is the gap that most position-tracking tools leave open. They show the position, the size, maybe the entry price. They do not tell you anything about the trader behind it because they do not classify wallets at all. HyperTracker's 16 cohorts fill that gap by classifying every active wallet on Hyperliquid, automatically, across both axes.
Three patterns to watch for:
High-conviction setups. Large notional, low liquidation progress, Money Printer or Smart Money cohort. This is a well-capitalized trader with a winning track record making a deliberate bet with plenty of margin buffer. The direction of this position is worth noting as a market signal.
Liquidation risk clusters. Large notional, high liquidation progress (above 50%), any cohort. These positions are fragile. If price moves against them, the forced closure can cascade, especially if several large positions on the same side are all near their liquidation levels. The liquidation risk endpoint (GET /{segmentId}/assets/liquidation-risk) gives you cohort-level exposure for deeper analysis.
Losing-cohort size. Large notional held by Exit Liquidity, Semi-Rekt, Full Rekt, or Giga-Rekt wallets. These traders have historically lost money, and they are now holding positions large enough to move the market if they close. The combination of poor track record and large exposure is a red flag worth tracking.
Building a daily routine around this
The simplest version of a daily biggest-positions check takes about two minutes. Open the HyperTracker Leaderboards page, scan the top 10, note any positions with liquidation progress above 50%, and check whether the cohort labels suggest conviction or desperation. That is the manual workflow, and it is enough for most discretionary traders.
For a programmatic version, a cron job that runs the /leaderboards/biggest-positions call every morning and diffs against yesterday's snapshot gives you:
- New positions that appeared overnight. These are fresh bets, and their cohort labels immediately tell you whether to pay attention.
- Positions that disappeared. A top-10 position that vanished was either closed intentionally or liquidated. Both are market events.
- Positions where liquidation progress climbed. A position that was at 20% yesterday and 45% today is under pressure. If it is large enough, the potential forced closure is a scenario worth modeling.
The pagination works via offset. Page 1 (offset 0, limit 100) gives you the top 100 positions. For most daily routines, the top 10 or 25 is more than enough context.
HIP-3 positions show up too
The biggest-positions leaderboard is not limited to crypto. HIP-3 assets (equities, commodities, indices traded as perpetual futures on Hyperliquid) appear in the same ranking. A $15 million xyz:SP500 long sits in the same leaderboard alongside a $33 million BTC short, ranked by the same absolute-notional logic. The cohort labels and liquidation metrics work identically across both market types.
This matters because HIP-3 positions can be significant enough to rank in the top 20, and their directional signal is different from crypto-native positions. A Leviathan going long on xyz:GOLD during a macro flight-to-safety is a different thesis than the same Leviathan going long on HYPE.
Track the biggest positions yourself
The biggest-positions leaderboard is live on the HyperTracker dashboard. For API access, the Pulse plan ($179/mo) includes 50,000 requests per month with access to the full leaderboards surface, cohort intelligence, and order flow. Free tier available (100 requests per day) if you want to test the endpoint before committing.
The position is the headline. The cohort is the story.
Anyone can tell you that the biggest position on Hyperliquid today is a $33 million BTC short. That is a fact you could get from any block explorer with enough patience. But knowing that the holder is a Leviathan with a Money Printer track record, that their liquidation price is far from the current mark, and that they opened the position 14 days ago tells you something the raw number never could. The position is the headline. The cohort is the story. And the daily check is how you read it.