
How Hyperliquid Builder Codes Actually Split Revenue
By CMM Team - 22-Sep-2026
How Hyperliquid Builder Codes Actually Split Revenue
Builder codes are the simplest monetization mechanism in DeFi, and somehow the most misunderstood. Developers hear "revenue share" and imagine complex splits, negotiated rates, or token-gated access. The reality is cleaner than that. A builder routes trades through Hyperliquid, tags each order with a fee parameter, and collects that fee every time the order fills. No tokens. No subscriptions. Just volume multiplied by a fraction of a basis point.
But the details matter. The fee caps differ between perps and spot. The user has to explicitly approve the fee before it kicks in. And the actual revenue numbers across the top builders reveal patterns that most analysis skips over entirely, because two builders with identical fee rates can earn wildly different amounts depending on who their users are.
Figures referenced below are as of July 2026, from HyperTracker's builder leaderboard.
The Mechanics: One Fee, Two Parties, Zero Complexity
A Hyperliquid builder code is a per-order fee that an application charges on trades it routes through HyperCore. The code is set on each individual order, which means a builder can charge different rates on different trades if it wants to. There is no blanket "this builder charges X%" setting. Every order carries its own fee instruction.
To become a builder, you need 100 USDC in a Hyperliquid perpetuals account. That's it. No application process, no staking requirement beyond that minimum balance, no approval committee. You register your builder address, and you can start attaching fees to orders immediately.
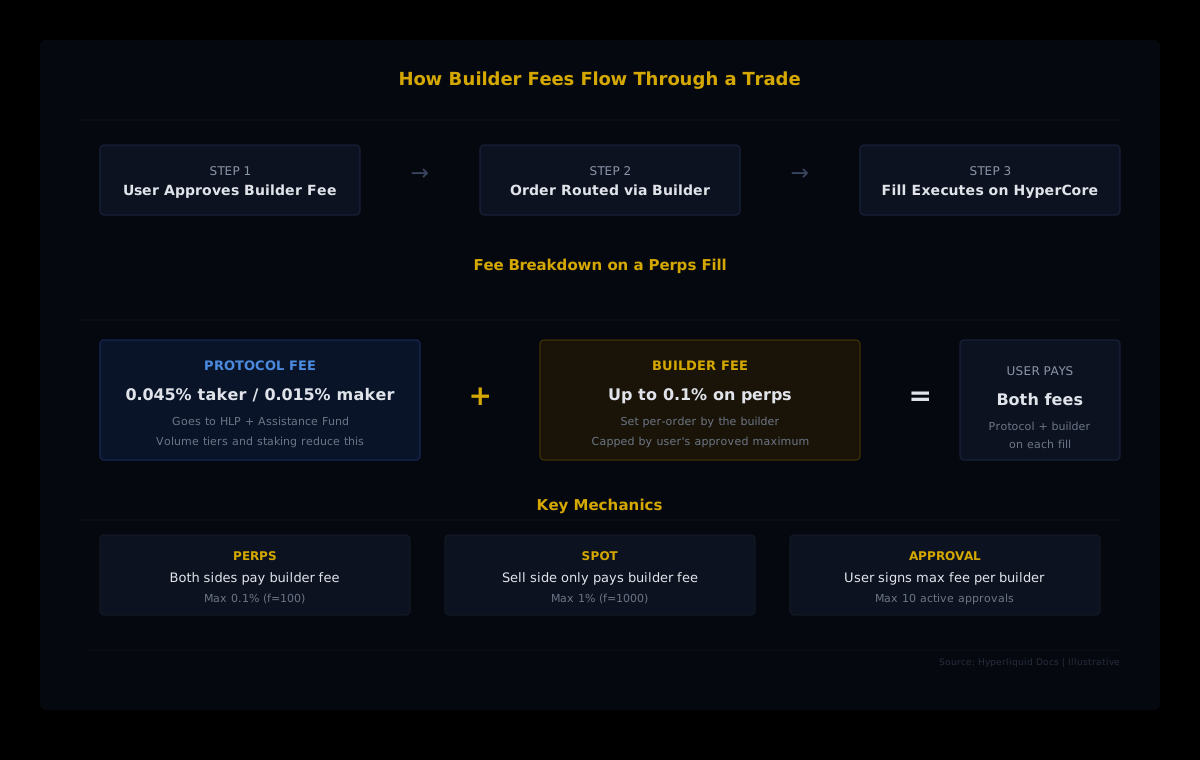
The fee parameter, labeled f in the order payload, is denominated in tenths of basis points. So f: 10 means 1 basis point (0.01%), and f: 100 means 10 basis points (0.1%), which is the maximum for perpetual contracts. For spot trades, the ceiling is higher at 1%.
Where the Money Actually Goes
This is where most explainers get it wrong. Builder fees are not a share of Hyperliquid's protocol fees. They are a separate, additional charge on top of the protocol's maker/taker fees. When a trade fills through a builder app, the user pays two things: the standard Hyperliquid protocol fee (which goes to HLP and the assistance fund), and the builder fee (which goes directly to the builder's account).
For perpetual trades, the builder fee applies to both sides of the fill. Spot is different: builder fees only apply to the sell side. This distinction matters for builders who route both perp and spot volume, because their effective revenue rate per dollar of spot volume is roughly half what they earn on perps.
The User Controls the Cap
Before any builder fee can be charged, the user must sign an ApproveBuilderFee action with their main wallet (agent wallets and API keys cannot approve builder fees). This approval sets a maximum fee that the builder can charge. The builder can set any fee up to that cap on each order, but never above it. Users can revoke approval at any time, and each user can hold a maximum of 10 active builder approvals simultaneously.
This is a meaningful design choice. The user is always in control of their worst-case fee exposure, and builders compete on the actual fee they charge (since setting a lower fee makes your app more attractive). It creates downward pressure on builder fees over time, because a competitor can always undercut you.
What the Top Builders Actually Earn
Theory is useful, but revenue data tells a more interesting story. Across 1,411 builders on Hyperliquid, all-time builder revenue totals $90.7 million on $274.9 billion in routed volume. But that revenue is concentrated heavily at the top.
The top builder, Phantom, has earned $23.6 million across 153,128 users. Based sits second at $15.2 million with 42,967 users. MetaMask is third with $8.1 million from 52,534 users, and PVP is close behind at $8.0 million from 28,223 users.
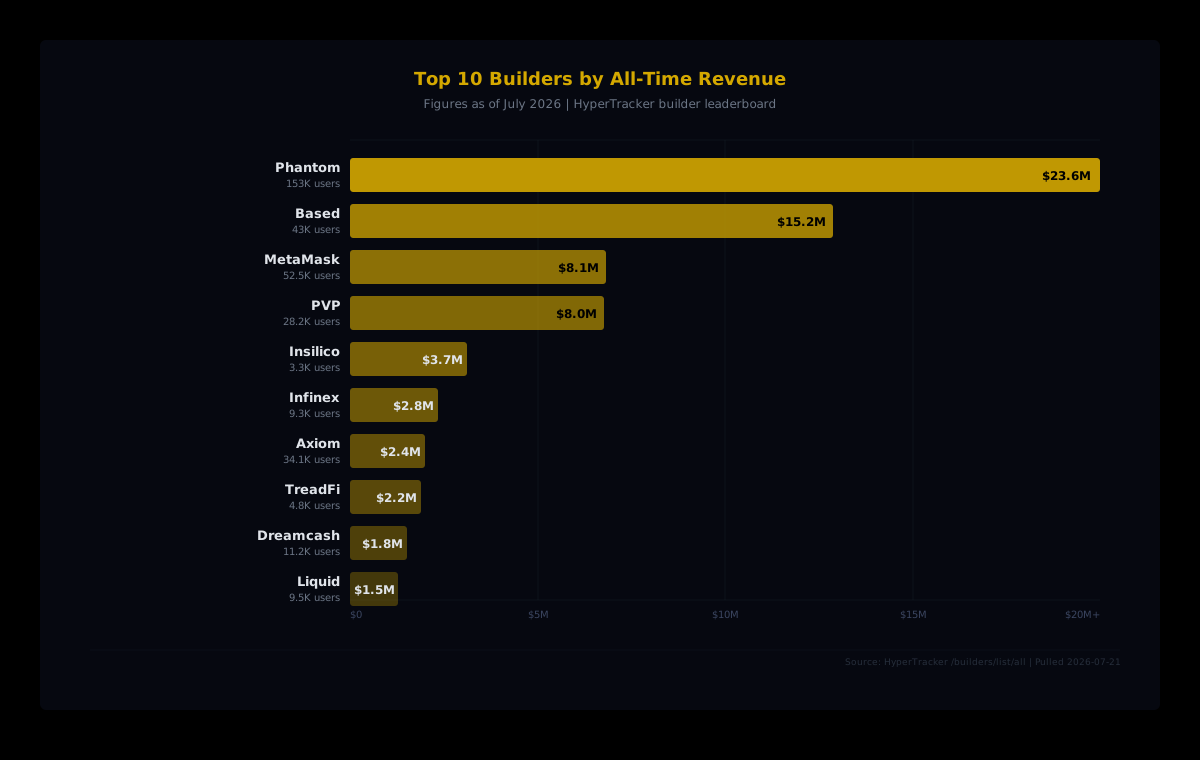
But total revenue alone is deceptive. The revenue-per-user metric tells you something the raw leaderboard doesn't: which builders are monetizing high-value traders versus capturing volume through sheer user count.
Revenue Per User: The Hidden Divergence
Insilico, ranked fifth by total revenue at $3.7 million, has only 3,339 users. That works out to roughly $1,113 in revenue per user. Mass, further down the list at $1.5 million in total revenue, earns around $1,395 per user from just 1,054 accounts.
Compare that to Phantom's $154 per user or MetaMask's $154 per user. Both wallet integrations earn at massive scale because they funnel enormous user bases through Hyperliquid's order book. But each individual user generates a fraction of what a specialized trading tool like Insilico extracts.
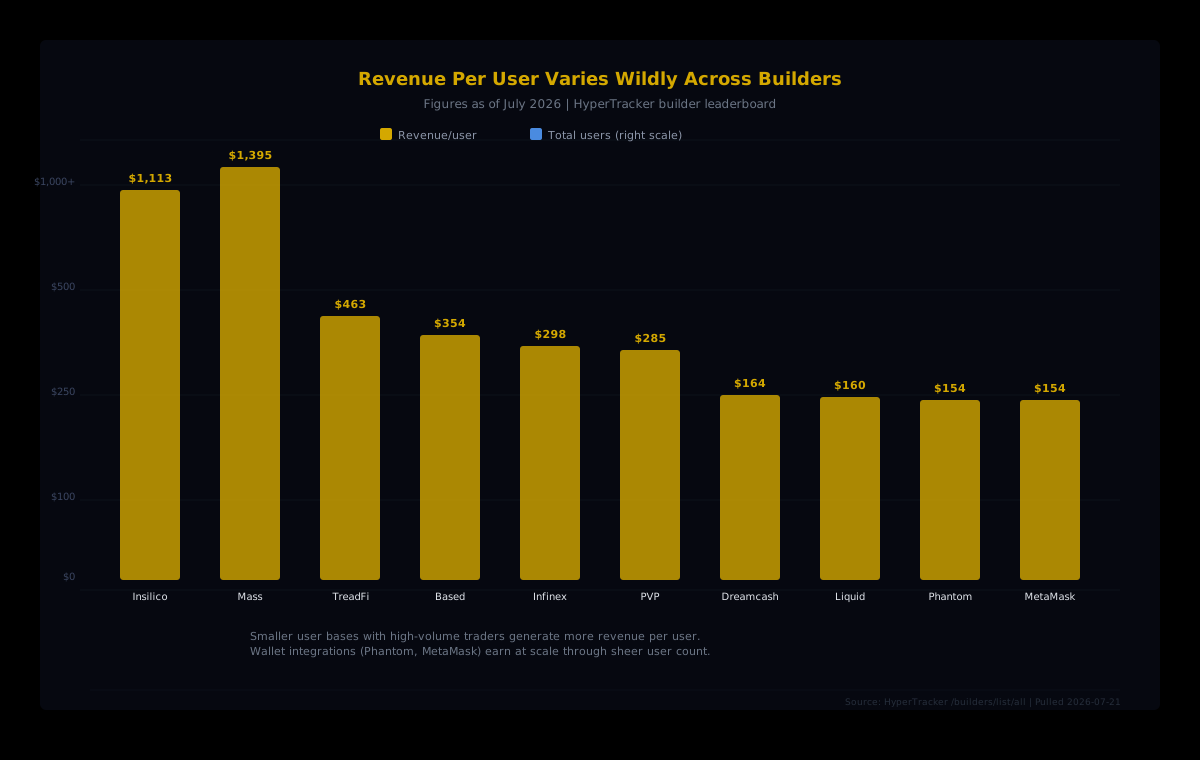
This split reveals two distinct builder business models on Hyperliquid. Wallet integrations (Phantom, MetaMask, Rabby) operate on a high-volume, low-margin basis. They provide a gateway to Hyperliquid from an existing user base and collect modest fees across millions of transactions. Trading tools and specialized platforms (Insilico, Mass, TreadFi) serve smaller, more active user bases and generate significantly more revenue per account because their users trade larger sizes more frequently.
Builder Fees vs. Referral Rewards: They Stack
A common point of confusion: builder codes and referral codes are two separate systems. A referral code gives a new user a 4% discount on protocol fees for their first $25 million in volume, while the referrer earns 10% of the referred user's fees across their first $1 billion in volume. The referral discount applies to Hyperliquid's protocol fee. Builder fees sit on top, completely separate.
A user trading through a builder's app can have both an active referral and an active builder fee approval. The referral discount reduces the protocol fee they pay. The builder fee is added on top of whatever protocol fee remains. Both the builder and the referrer earn from the same user's trades, through different mechanisms.
Staking HYPE introduces another layer. Builders and referrers who stake can earn enhanced rewards through Hyperliquid's staking referral program, where the reward scales based on the difference between the staker's tier discount and their referred user's discount. A builder staking enough HYPE to reach the highest tier could receive up to 40% of protocol fees on referred volume, on top of their builder fee.
The Math Behind a Builder's Revenue
Let's walk through a concrete example using real fee parameters. Imagine a builder routes a $100,000 perp trade at a builder fee of f: 50 (5 basis points, or 0.05%).
The builder fee on that fill: $100,000 × 0.0005 = $50. Since perp builder fees apply to both sides, the builder collects $50 on each side of the fill that involves their routed order. If the builder's app submitted both the buy and the sell (which is common for copy-trade platforms filling against their own users), they collect on both sides.
Scale that to $10 million in daily routed volume at the same fee rate, and you're looking at $5,000 per day, $150,000 per month, or $1.8 million annually. That's with a fee rate well below the 0.1% maximum.
The fee parameter gives builders fine-grained control. A builder targeting retail users might set f: 30 (3 basis points) to stay competitive. A builder offering premium execution tools to quant teams might push closer to the cap at f: 100 (10 basis points), betting that the tool's value justifies the higher fee. The market decides which fee levels are sustainable.
Tracking Builder Performance Programmatically
Hyperliquid publishes builder fill data daily in LZ4-compressed CSV format, which means anyone can reconstruct a builder's revenue history from raw on-chain data. But that requires parsing compressed files, aggregating across days, and handling edge cases like builder address changes.
HyperTracker's builder leaderboard endpoint does this automatically. A single API call to /builders/list returns every active builder's revenue, user count, and volume across any timeframe. Our data covers all 1,411 builders with all-time, monthly, weekly, and daily breakdowns, so you can track which builders are growing, which are stalling, and which user segments drive the most volume.
For builders themselves, this data is useful for benchmarking. If you know that the median revenue-per-user for your category of builder is a certain amount, you can evaluate whether your fee rate is competitive or leaving money on the table.
Monitor Builder Revenue with HyperTracker
Track all 1,411 Hyperliquid builders: revenue, users, volume, and growth trends. One API call gives you the full leaderboard or any builder's detailed breakdown.
Explore the Builder Leaderboard
What Builder Codes Tell You About Hyperliquid's Ecosystem Health
The $90.7 million in all-time builder revenue is a proxy for something larger: the portion of Hyperliquid's volume that flows through third-party applications rather than the native interface. When that number grows, it means the ecosystem is becoming more composable. More tools, more frontends, more ways to access the same liquidity pool.
The revenue concentration at the top also tells a story. The top 5 builders account for the majority of revenue, which suggests that a few high-quality applications drive most of the third-party volume. But the long tail of 1,411 builders signals that the barrier to entry is genuinely low, and new builders keep showing up to compete.
For traders, builder code data is a window into where volume is flowing and which frontends are gaining traction. For builders, it's a competitive intelligence source. And for anyone evaluating Hyperliquid as a platform, the growth in builder-routed volume is one of the clearest signals that the ecosystem is maturing beyond a single interface.
The fee math is simple. The strategy around it is where it gets interesting.