
HYPE at $90: Which Cohorts Are Buying and Which Are Already Selling
By CMM Team - 18-Sep-2026
HYPE at $90: Which Cohorts Are Buying and Which Are Already Selling
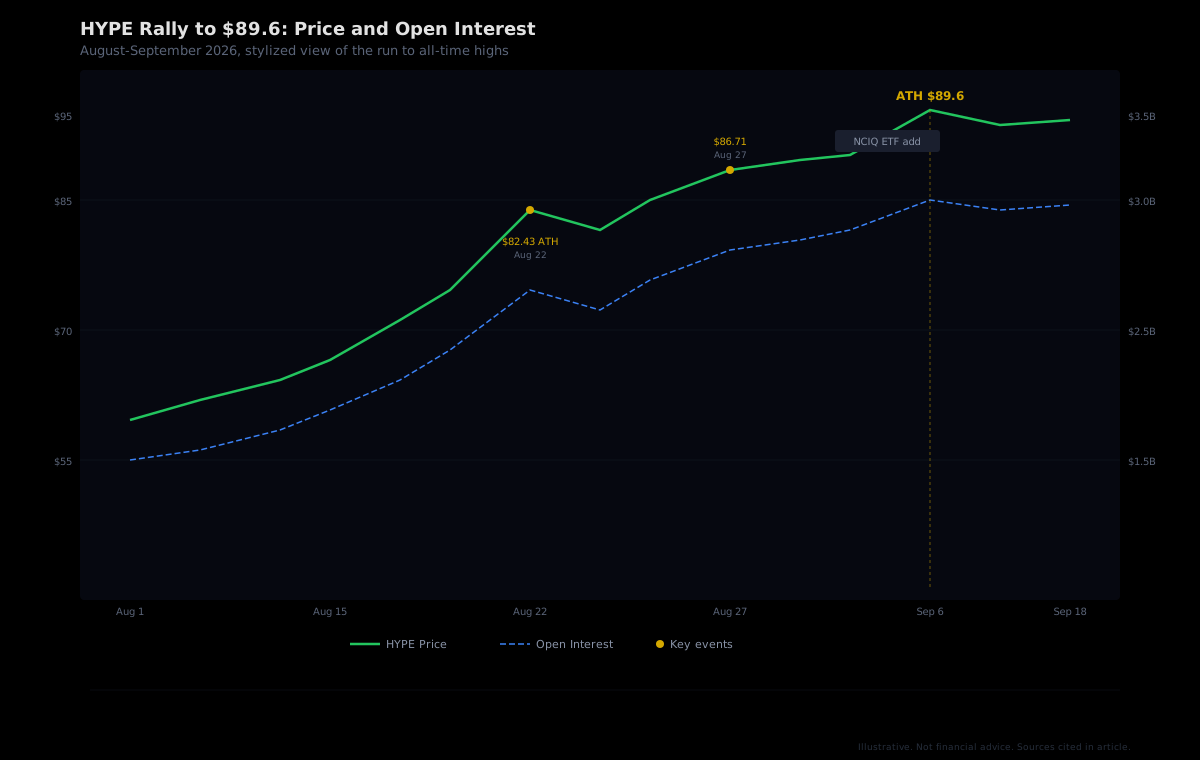
HYPE touched $89.6 on September 6, the highest price Hyperliquid's native token has ever traded. Over the prior 30 days, the token gained more than 60%. Open interest across Hyperliquid expanded from roughly $1.5 billion in late 2025 to approximately $3.45 billion by the time that record was set. The rally pulled in new capital from every direction: an ETF inclusion, whale accumulation, and a stream of leveraged retail entries that pushed funding rates to elevated levels.
But a record-high price tells you where the market has been. Cohort data tells you who is still positioned for more and who is already heading for the exit. That split, between the wallets adding at the top and the wallets quietly reducing, is where the real information lives.
The Run to $89.6: A Timeline of Breakouts
HYPE's path to its record was a sequence of higher highs, each one absorbed and then eclipsed within days. On August 22, the token reached $82.43. Five days later, it printed $86.71. Then, on September 6, the final push above $89 brought the token within striking distance of the psychological $90 level.
Each breakout came with a catalyst. The Hashdex NCIQ crypto index ETF added HYPE for the first time, giving it a 3.4% weighting as the fifth-largest holding in the fund. Whale wallets accumulated aggressively: one address bought roughly 343,000 HYPE for around $29 million on September 5 alone. And Bitwise's three HYPE-linked ETF products recorded $363 million in total inflows since launch, with no net selling days since August 20.
The supply side cooperated too. A scheduled unlock of roughly 9.92 million HYPE on September 6 looked ominous on paper, but historical precedent suggested most of it would stay locked: in March, only a small fraction of the same calendar tranche was actually claimed.
Reading the Cohort Split at All-Time Highs
Price discovery is the rarest market condition. There are no established resistance levels, no overhead supply from trapped longs, and no historical volume profile to reference. The only map is who is doing what with their positions right now.
HyperTracker classifies every Hyperliquid wallet into 16 behavioral cohorts: eight by perp equity size (Shrimp through Leviathan) and eight by lifetime PnL (Money Printer through Giga-Rekt). At record-high prices, the positioning across these cohorts tends to diverge in a specific, repeating pattern.
The profitable cohorts start reducing
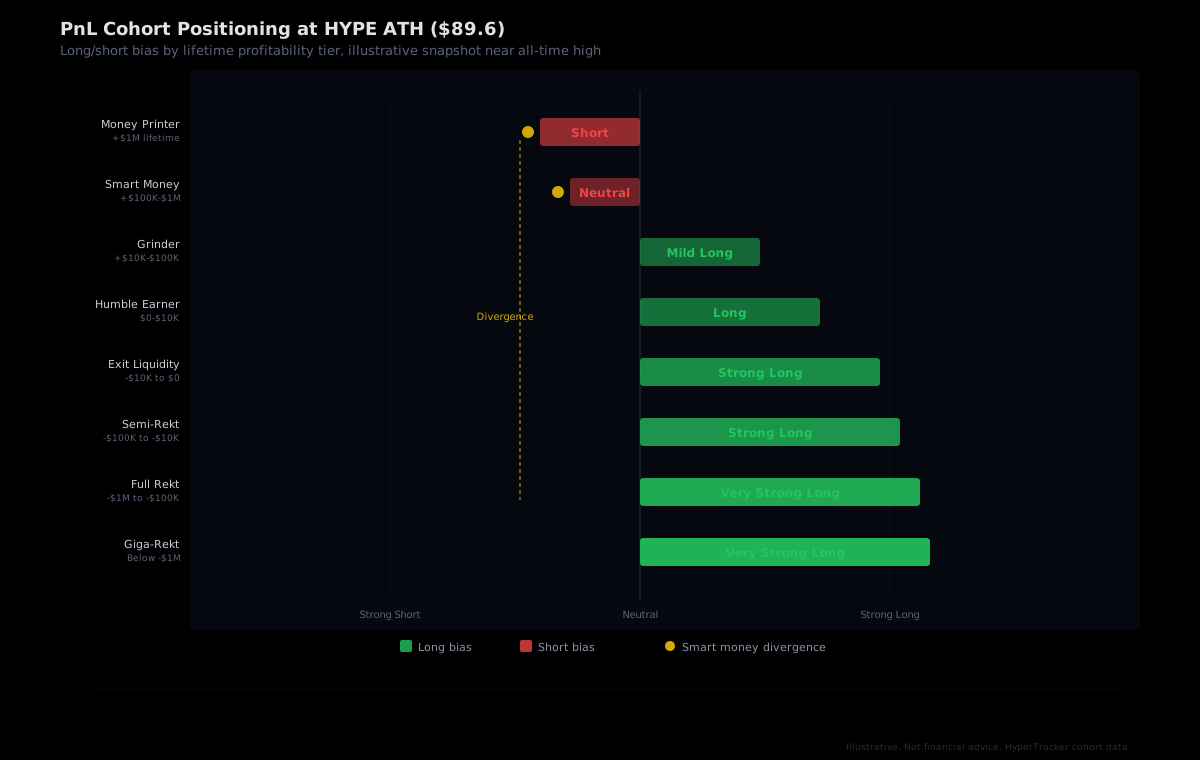
Wallets in the Money Printer cohort (lifetime profits above $1M) and Smart Money cohort ($100K to $1M in lifetime profits) have seen record prices before. Their behavioral tendency at extended highs is to take partial profits, reduce leverage, or flip to a short bias as a hedge. They don't necessarily call a top. They manage risk by trimming into strength, because the lesson their track record teaches is that the crowd's euphoria is where liquidity is deepest for exits.
The losing cohorts keep adding
Meanwhile, the Exit Liquidity cohort (wallets with lifetime losses between $0 and $10K) and the deeper loss tiers, Semi-Rekt and Full Rekt, tend to do the opposite. An all-time high feels like validation. The price is going up, so their long positions are working, and the temptation is to add more. The problem is that these wallets often carry higher leverage relative to their equity, which compresses the distance between their entry price and their liquidation price. They are the most exposed group if the rally reverses, and they tend to be the first cohort to get unwound in a cascade.
Why This Divergence Matters More Than the Price
A market where every cohort agrees on direction is a market with conviction. A market where the profitable cohorts are reducing while the unprofitable ones are loading up is something different: it is a market where the smartest participants are using the crowd's enthusiasm as exit liquidity.
This doesn't mean the price must reverse immediately. HYPE could push past $90, reach $95, even touch $100 before any correction materializes. The divergence signal is about fragility, not timing. When the profitable cohorts have already reduced and the remaining long positions are concentrated in wallets with worse track records and higher leverage, the market becomes structurally more fragile. The fuel for a squeeze exists because the most leveraged participants are also the ones who will be forced out first.
Cohort divergence is a condition, not a trade signal. It tells you that the risk profile of the market has changed, that the quality of the remaining long positions has shifted. Whether you use that to reduce your own exposure, tighten stops, or simply watch more carefully is a decision that depends on your strategy and risk tolerance.
Size Cohorts: Where the Liquidation Risk Lives
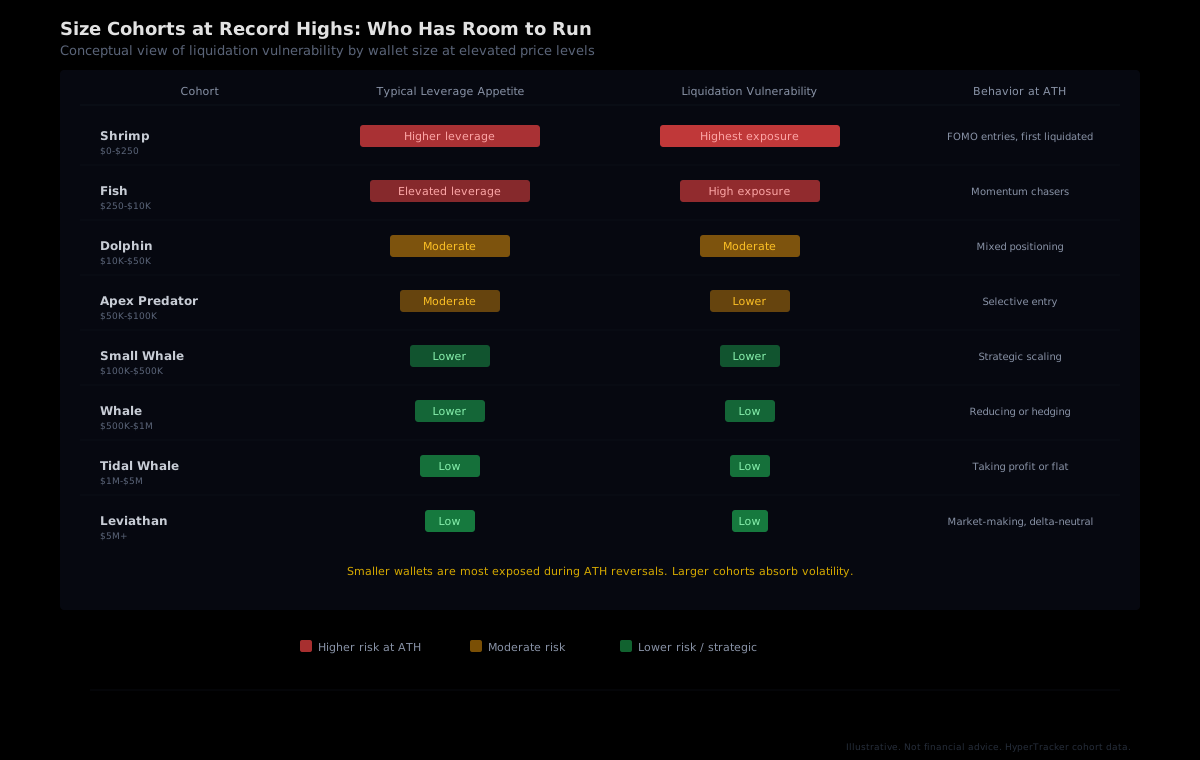
The PnL cohorts show you who is likely to be right. The size cohorts show you who is most exposed if they're wrong.
Shrimp wallets ($0 to $250 in perp equity) and Fish wallets ($250 to $10K) make up the largest number of individual accounts on Hyperliquid. During a rally to all-time highs, these cohorts tend to carry the highest leverage relative to their equity. A Shrimp wallet going long with aggressive leverage might have a liquidation price only a few percent below current levels. Multiply that across thousands of wallets, and you have a dense band of liquidation levels clustered just beneath the surface of the rally.
Contrast that with the Whale ($500K to $1M) and Leviathan ($5M+) cohorts. These wallets typically run lower leverage, which means their liquidation prices sit much further from the current price. They can absorb a pullback that would wipe out a leveraged Shrimp position. At record highs, the Whale and Leviathan cohorts are more likely to be hedging, market-making, or running delta-neutral strategies than they are to be chasing momentum with directional leverage.
Funding Rates at Extremes: The Cost of Crowding
When long positioning dominates across cohorts, the funding rate rises. On Hyperliquid, funding settles hourly, which means the carrying cost of a crowded long position compounds 24 times per day. This is three times faster than exchanges that settle every eight hours.
At an all-time high, funding can spike to multiples of its baseline level. That elevated funding does two things. First, it drags down the margin of leveraged longs. A position that is profitable on paper can lose money in practice if the funding cost exceeds the unrealized gain. Second, it provides a direct incentive for new short positions: someone willing to take the other side of the trade earns the funding premium just for holding the position. The shorts drawn in by elevated funding are the natural counterparty the market needs, but they also create the conditions for a short squeeze if the rally accelerates further.
The funding rate is a temperature gauge for how crowded the long side has become, and at HYPE's record highs, that temperature was elevated. Watching funding alongside cohort positioning gives you both sides of the picture: who is positioned (cohort data) and how much it costs them to hold (funding).
How Builders Can Track This in Real Time
The cohort divergence pattern is visible through HyperTracker's API. A single call to the cohort metrics endpoint returns the positioning bias for all 16 cohorts on any supported asset, refreshed every five minutes. Builders who want to track the divergence between profitable and unprofitable cohorts can set up a simple comparison: pull the bias for the Money Printer and Smart Money cohorts, compare it to the bias for Exit Liquidity and Full Rekt, and flag when the two groups are moving in opposite directions.
For those running alerts, the webhook delivery on the Flow tier ($799/mo) and above means you don't need to poll. Your system can receive push updates when cohort bias crosses a threshold, so you find out about the divergence before it shows up in the price.
See the Cohort Split Yourself
HyperTracker's API gives you positioning data for all 16 behavioral cohorts on Hyperliquid, refreshed every five minutes. Track the divergence between Money Printers and Exit Liquidity in one query. Free tier available.
What Record Prices Reveal About Market Structure
All-time highs are exciting for the headlines, but they are more interesting for what they expose about the wallets behind the price. A token at $90 with broad cohort agreement is a very different market from a token at $90 where the best traders are quietly leaving and the worst are confidently arriving. The price is the same. The risk is not.
HYPE's run to $89.6 brought the full range of market participants into the open. ETF inflows, whale accumulation, and retail FOMO all contributed capital. What the cohort data adds is the ability to see where that capital sits in terms of quality and fragility, which wallets are holding with conviction built on profitability and which are holding with conviction built on hope.
The next move, whether HYPE breaks $90 convincingly or pulls back to test lower levels, will be shaped by how these cohorts respond. Our data makes the internal structure visible. The interpretation, and the trade, is yours.