
Reading the Hyperliquid Order Book Through the API: Depth, Spread, and What They Actually Tell You
By CMM Team - 25-May-2026
Reading the Hyperliquid Order Book Through the API: Depth, Spread, and What They Actually Tell You
Most retail traders glance at the order book on Hyperliquid's UI, see green bars on one side and red bars on the other, and form a casual impression: more green than red means "buyers in control." That impression is wrong slightly more often than it's right. The order book is one of the most information-dense data structures in trading, and the way it's typically displayed compresses out almost everything that matters.
Programmatic access to the same data through the Hyperliquid API turns the order book into a structured signal. You stop reading bars and start reading the shape of liquidity — where it concentrates, how it shifts when price approaches, and what the spread is doing relative to its own recent history. Combined with cohort positioning data, these readings answer questions the UI can't: who's putting up the liquidity, who's taking it, and whether the visible bids are real intent or pulled-on-touch noise.
This article walks through the practical mechanics of reading Hyperliquid's order book via the API: what depth and spread actually measure, the three book shapes that recur on every perp asset, and how to combine order book reads with cohort data to filter noise from signal.
What the order book actually represents
A perpetual futures order book is a snapshot of resting limit orders on both sides of the market. Each level shows the cumulative quantity available at a specific price. The "spread" is the difference between the highest bid and the lowest ask. The "depth" is how much volume sits within some band of prices around the mid.
Two things make order books harder to read than they look:
-
Liquidity is not commitment. A resting bid is an offer to buy at a price if someone is willing to sell. The maker can cancel that order in milliseconds. Most of what shows on a busy perp order book is opportunistic liquidity that disappears when price approaches.
-
The display compresses information. UI order books typically show 10-20 levels per side. The API exposes 50+ on each side, plus the full time series of how those levels have changed. The signal lives in the levels and dynamics that don't fit in the UI.
The API gives you both — the snapshot at any moment, and the ability to track how the book evolves second-to-second. That's where the analytical edge starts.
Pulling the order book programmatically
Hyperliquid's order book is accessible through their public WebSocket and REST endpoints. The HyperTracker API wraps and normalizes this access, adds historical persistence, and overlays cohort positioning data.
A basic snapshot pull:
import requests

# Pull current order book for BTC perp
ob = requests.get(
    "https://api.hypertracker.cmm.app/orderbook/BTC",
    headers={"Authorization": "Bearer YOUR_API_KEY"}
).json()

# Structure:
# {
#   "timestamp": "2026-05-25T14:30:00Z",
#   "mid": 81234.50,
#   "spread_bps": 1.2,
#   "bids": [{"price": 81234.0, "size": 4.5}, ...],
#   "asks": [{"price": 81235.0, "size": 3.8}, ...],
#   "depth_1pct": {"bid": 142.3, "ask": 138.7},   # BTC within 1% of mid
#   "depth_5pct": {"bid": 1284.5, "ask": 1247.2}, # BTC within 5% of mid
# }
The most useful derived metrics on each pull:
mid— average of best bid and best ask, the "true" price for analytical purposesspread_bps— spread in basis points (1 bps = 0.01%), normalized for cross-asset comparisondepth_1pct/depth_5pct— total resting size within bands. The ratio of bid depth to ask depth at a given band is your imbalance signal.depth_imbalance— (bid_depth - ask_depth) / (bid_depth + ask_depth), ranged -1 to +1
Three order book shapes that recur
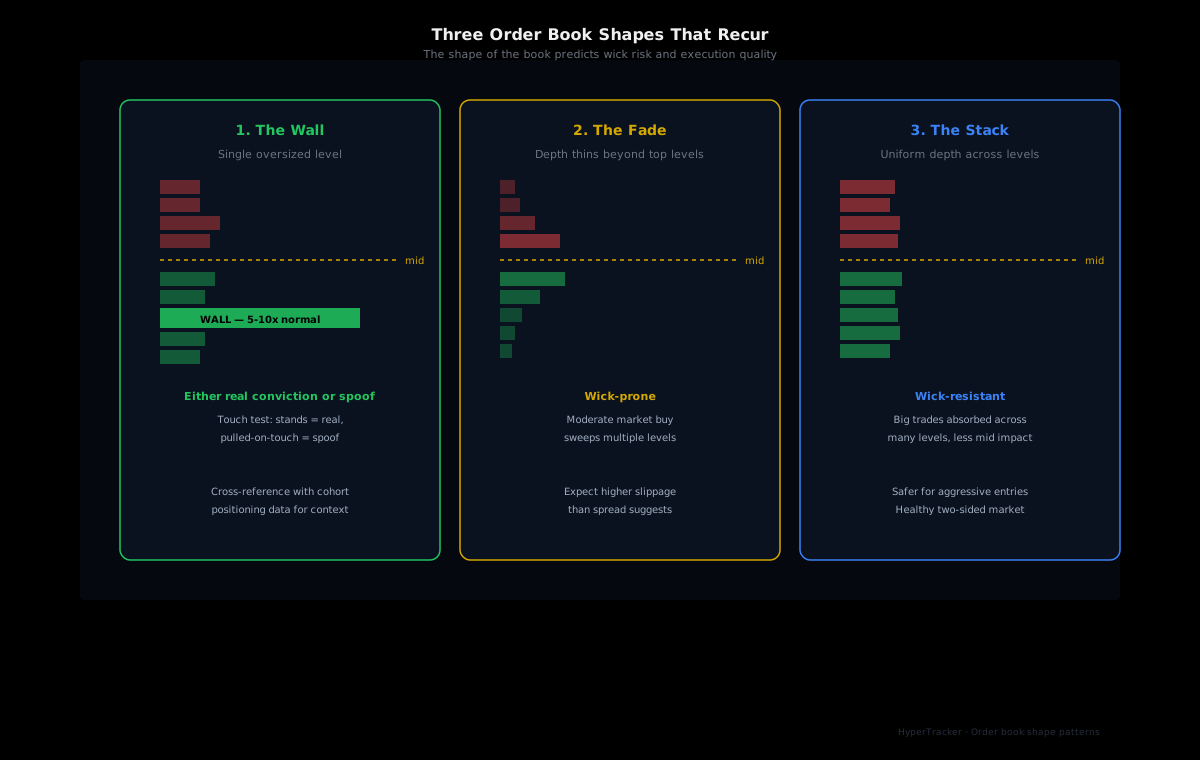
Across hundreds of order book snapshots, three structural patterns show up enough to be worth naming:
1. The wall
A single level (or tight cluster) with significantly more size than the levels around it. Often 5-10x the average size at adjacent levels. On the bid side, this looks like a "floor"; on the ask side, a "ceiling."
What it means: Either a real buyer/seller with conviction at that level (will defend the price), or a spoof intended to make smaller traders fade away.
How to tell the difference: Wait for price to touch the wall. If the wall stands through the touch, it's real. If it gets pulled the moment price approaches and reappears on a different level after price moves away, it's likely spoofing — though HyperLiquid's order book transparency makes high-volume spoofing more visible and therefore less common than on CEXes.
2. The fade
A book where depth thins out aggressively beyond the first few levels. Best bid and best ask each have decent size, but at 1% away from mid, depth has dropped 80%+ from where it was at the top of the book.
What it means: Market makers are providing tight, low-conviction liquidity. They're willing to facilitate small trades but not absorb size moves. This is a common shape in low-volatility consolidation periods.
How to read it: Fade-shaped books are wick-prone. When liquidity thins fast, a moderate market buy can sweep multiple levels and push price 2-3% in a single candle. If you're holding a position with a stop in a fade-shaped book, expect higher wick risk than the visible spread suggests.
3. The stack
A book where depth is roughly uniform across multiple levels, often with 5-10 levels of size that's within 30% of each other. The book has "shoulders" — substantial depth not just at the top but a couple of percent down.
What it means: Multiple market makers competing or genuine two-sided interest. This is the shape that supports orderly price discovery. Big trades get absorbed across many levels instead of sweeping one.
How to read it: Stack-shaped books are wick-resistant. A 5% market order on a stack book causes mid to move much less than the same order on a fade book. If you're sizing a market entry and the book is stack-shaped, you can be more aggressive without expecting outsized slippage.
The spread, in context
Spread by itself is hard to interpret because the right reference is asset-specific. BTC perps usually trade at 1-2 bps spread on Hyperliquid; a long-tail HIP-3 market might have 30-50 bps. The signal isn't the absolute number — it's the change relative to the asset's own recent baseline.
Three spread patterns worth tracking:
Compression: spread narrows below recent baseline. Often precedes a price move because tighter spreads attract more aggressive flow. Sustained compression is a leading indicator that something is about to break.
Widening: spread expands sharply, often during news events, liquidations cascades, or funding extremes. The instantaneous wider spread is also a slippage warning — market orders during widening will fill worse than expected.
Pulsing: spread oscillates between two visible states (e.g., 1 bps and 3 bps), often on a regular cadence. Usually indicates a single market maker dominating quote provision, pulling and replacing levels rhythmically.
Track spread as a ratio to its 24-hour median rather than absolute bps. That normalizes across assets and gives you a clean "is this normal" measurement.
Combining order book reads with cohort data
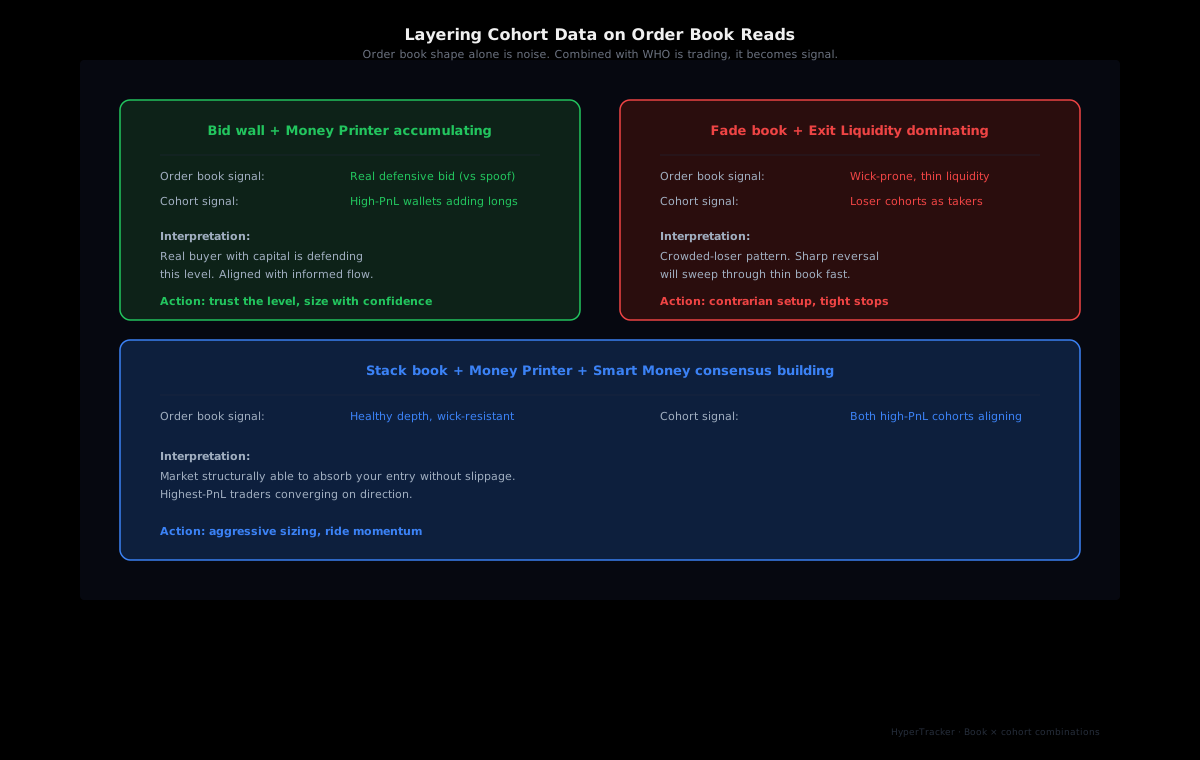
The thing that turns order book mechanics into actual trader edge is layering in who is doing the trading. Order book reads tell you the shape of liquidity. Cohort data tells you the composition of takers and makers.
A practical combination:
Setup: Wall on the bid side + Money Printer cohort going long over recent hours. A real bid wall typically requires capital. If the cohort data shows Money Printer wallets accumulating long exposure in the same window, the wall is more likely to be defensive (real buyer) than spoofing.
Setup: Fade-shaped book + Exit Liquidity cohort dominating taker volume. Thin book combined with unprofitable cohorts driving the taker side is a classic crowded-loser pattern. The first sign of reversal will sweep through the thin liquidity disproportionately fast.
Setup: Stack book + cohort consensus building. When the book is healthy and high-PnL cohorts are converging on a direction, position sizing can be more aggressive. The market is structurally able to absorb your entry without significant impact.
These aren't trades — they're filters. Order book shape alone is too noisy. Cohort positioning alone misses execution dynamics. The combination is more selective than either, and the math behind it is straightforward to encode in a screening function.
Practical considerations and limits
A few honest caveats:
Order book data is high-cadence. A useful order book monitor pulls snapshots every few seconds. That's many requests per minute per asset. Free tier API access (100 requests/day) won't sustain real monitoring. Pulse ($179/mo) or higher is needed for serious order book work.
Latency matters. REST snapshots are 1-3 second stale by the time you've parsed them. For execution-time decisions, WebSocket streams are required. The HyperTracker API includes both — REST for analytics, WebSocket for real-time.
Order book metrics decay fast. A snapshot from 30 seconds ago tells you almost nothing about the current book shape. Don't make decisions on stale data. If your strategy requires sub-second freshness, your infrastructure needs to support that.
Most of what looks meaningful is noise. Order books pulse and shift constantly. Most of the apparent "patterns" don't predict anything. The signals worth acting on are the ones that persist across multiple snapshots and align with other independent signals (cohort positioning, funding rates, on-chain flow). Single-snapshot reads are mostly entertainment.
What this enables
For traders building automated systems on Hyperliquid, programmatic order book access opens up a class of strategies that aren't practical from a UI:
- Spread arbitrage: monitoring spread compression to enter ahead of breakouts
- Liquidity-aware execution: routing market orders only when book shape supports clean fills
- Anti-spoofing filters: discounting walls that pull on touch in your signal-weighting
- Cohort-conditioned book reads: filtering all of the above through cohort positioning to bias toward setups where high-PnL traders agree
None of these are reachable through the UI. All of them are a few hundred lines of Python against the API.
Get programmatic access to Hyperliquid order book + cohort data →
The bigger framing
The UI is built for casual observation. The API is built for analytical work. Most retail traders interact with markets through UIs, which is why most retail traders see the same patterns and act on the same incomplete information. The traders who do meaningful work with order book data are the ones who pull it programmatically, persist it historically, and combine it with structural signals like cohort positioning that the UI doesn't expose.
The information advantage compounds. Every day you read books through the API, you're building a private dataset that helps you recognize patterns the next day. That dataset is the actual edge. The order book is just where the data lives.