
The Fed Hiked Rates. Hyperliquid Cohorts Were Already Moving.
By CMM Team - 17-Sep-2026
The Fed Hiked Rates. Hyperliquid Cohorts Were Already Moving.
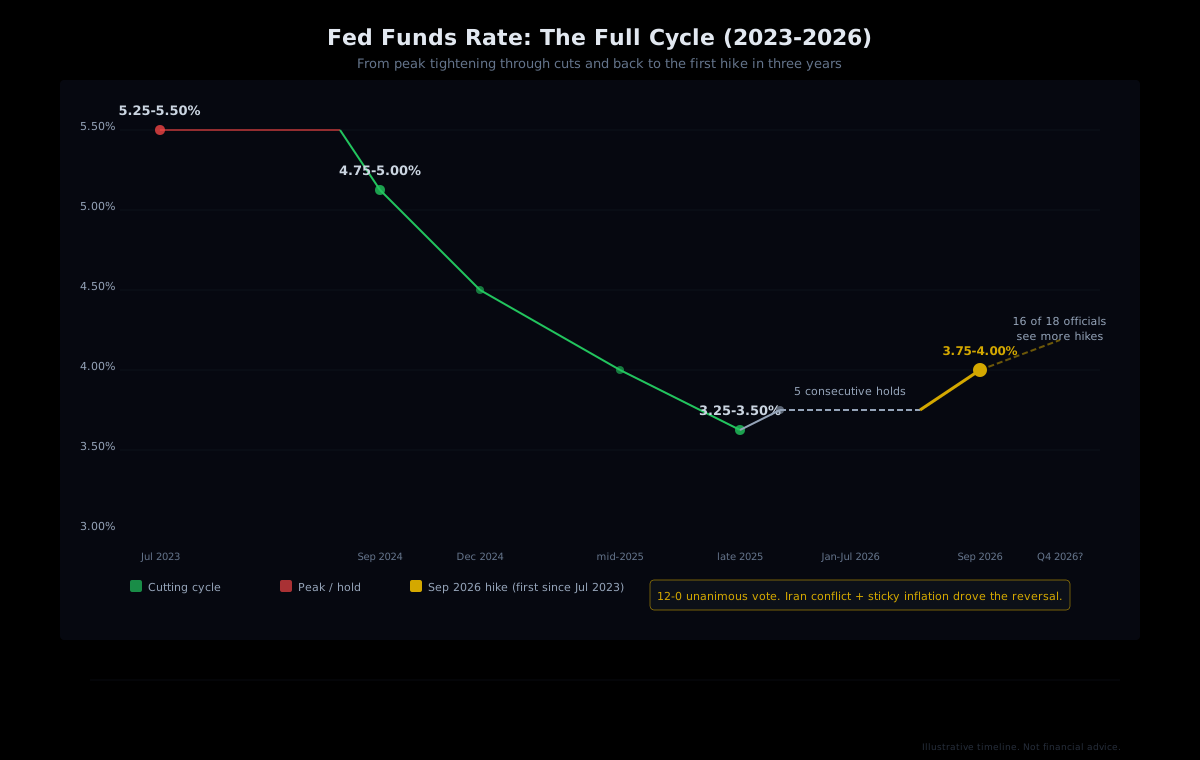
The Federal Reserve raised its benchmark interest rate by 25 basis points on September 16, pushing the target range to 3.75%-4.00%. It was a unanimous 12-0 vote and the first rate hike since July 2023, when the Powell-era Fed pushed rates to their cycle peak of 5.25%-5.50%. After more than two years of cuts and holds, the direction reversed.
Bitcoin dipped to roughly $75,350 before the announcement, bounced past $76,100 within minutes, and eventually settled near $76,000. Ethereum traded near $2,400. More than $455 million in leveraged positions were liquidated over the following 24 hours. The headline numbers tell one story. The cohort-level data tells a more interesting one.
Because on Hyperliquid, where every position is an on-chain transaction, you can see exactly which types of traders got squeezed, which ones were already positioned, and which ones are now buying the dip. That behavioral breakdown is what separates macro noise from actionable intelligence.
The Rate Decision: Why It Mattered This Time
Rate decisions are usually priced in well before the announcement. This one was different. As recently as June 2026, the consensus was still leaning toward cuts. The Iran conflict changed the math. Disruptions around the Strait of Hormuz pushed oil prices higher, keeping energy costs elevated and inflation sticky. The July FOMC meeting saw a 9-3 vote to hold, with three dissenters favoring a hike, which was the first hawkish dissent in over a year.
By September, markets had priced in a roughly 65% probability of a hike, but the crypto market had already been softened by a separate catalyst: the CLARITY Act's failure in the Senate, which triggered roughly $300 million in long liquidations and pushed Bitcoin below $75,000 in the days before the FOMC meeting.
Fed Chair Kevin Warsh was hawkish in his press conference, noting that "the plain fact is that inflation is too high, and has been for too long" and that summer inflation readings showed no meaningful improvement. Updated projections showed 16 of 18 officials anticipating at least one additional 25-basis-point increase before year-end, which means the tightening cycle may not be a one-off.
What the Headline Numbers Miss
The aggregate story, BTC dips then recovers, $455 million liquidated, market digests the hike, is true but shallow. It tells you what happened to "the market." It doesn't tell you what happened to specific segments of traders with very different risk profiles, capital sizes, and track records.
That's where cohort analytics changes the picture. HyperTracker classifies every wallet on Hyperliquid into 16 behavioral cohorts: 8 based on position size (from Shrimp at $0-$250 to Leviathan at $5M+) and 8 based on all-time PnL (from Giga-Rekt at below -$1M to Money Printer at +$1M). When a macro event like a rate hike hits, these cohorts don't all behave the same way. The divergences are where the signal lives.
How Cohorts Typically Behave Around Macro Events
Rate decisions create a predictable sequence: anticipation, volatility, and resolution. What varies is how each cohort segment navigates that sequence, and those differences are observable through our data.
Before the Decision: Positioning Phase
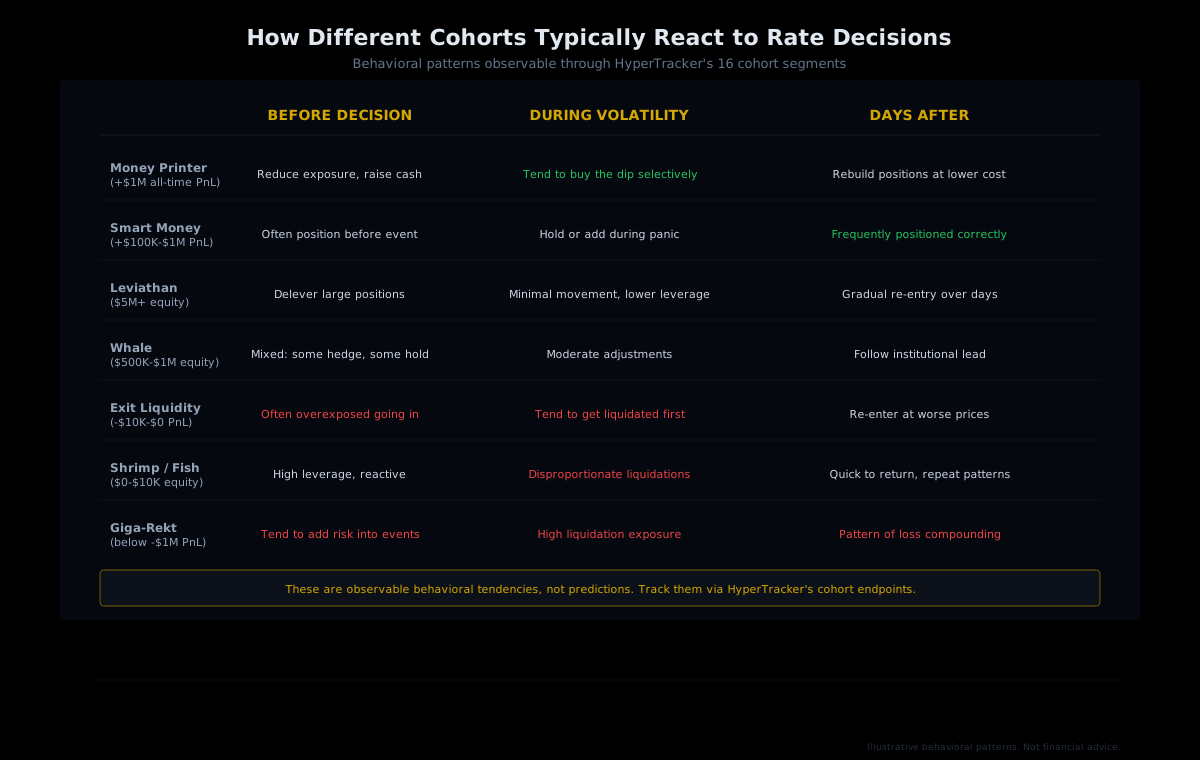
In the days leading up to a major macro event, larger and more profitable cohorts tend to reduce exposure. Money Printer wallets (+$1M all-time PnL) and Leviathans ($5M+ equity) often deleverage before the announcement. They've survived enough cycles to know that being right on direction but wrong on timing, especially with leverage, is a losing trade.
Smart Money cohorts (+$100K-$1M PnL) often take it a step further. Rather than simply reducing risk, they may pre-position for the expected outcome. If the market has priced in a hike but the cohort data shows Smart Money building long exposure, that divergence is worth paying attention to. It suggests the smart money believes the hike is already priced in and the post-announcement reaction will lean toward relief rather than panic.
On the other end of the spectrum, Exit Liquidity (-$10K-$0 PnL) and Giga-Rekt (below -$1M PnL) cohorts tend to carry elevated leverage into events. The behavioral pattern is consistent: these segments are more likely to be overexposed precisely when they should be cautious.
During the Volatility: The Cascade
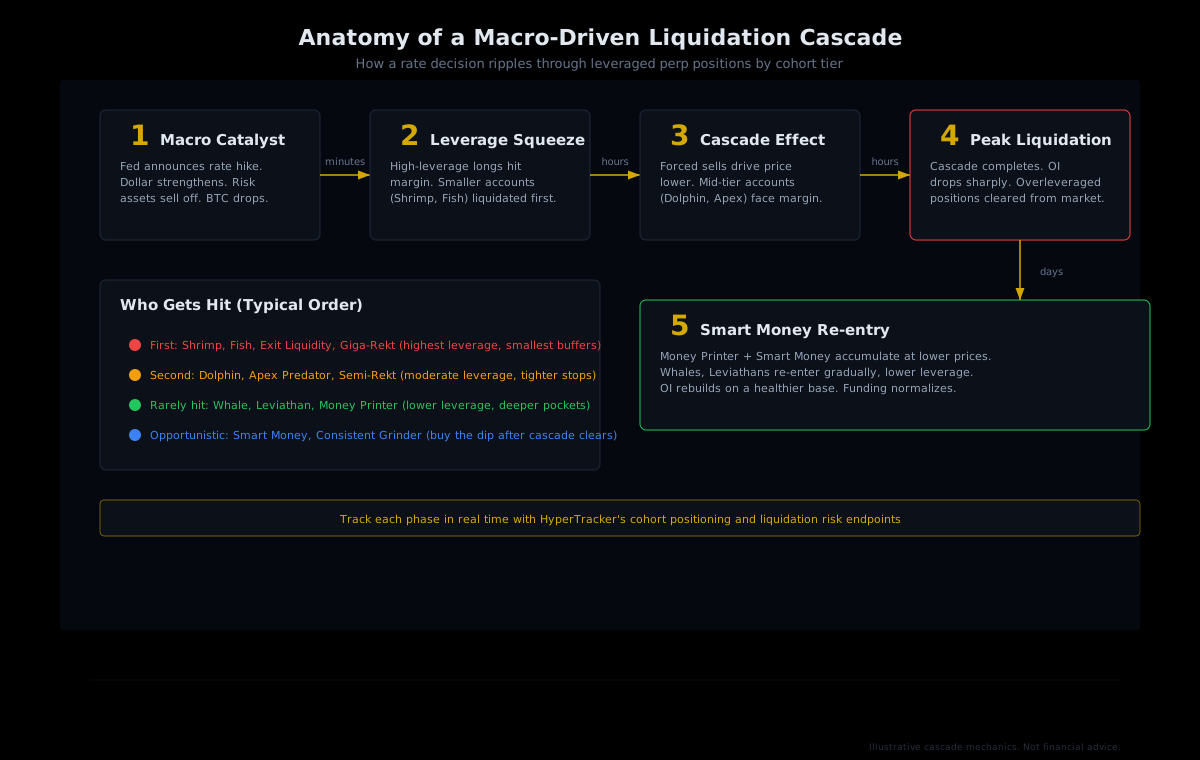
When the announcement hits and prices whip in both directions, the liquidation cascade follows a predictable order. Smaller accounts with higher leverage get wiped first. Shrimp and Fish cohorts, along with negatively-performing PnL segments, face disproportionate liquidation pressure because their margin buffers are thinnest.
As those forced sells drive prices lower, the cascade extends to mid-tier accounts. Dolphins ($10K-$50K equity) and Apex Predators ($50K-$100K) with moderate leverage may face margin calls they wouldn't encounter in a normal trading session. The compounding effect of simultaneous liquidations across thousands of positions is what turns a 2% dip into a 5% flush.
After the Dust Settles: Recovery Phase
This is where the cohort data gets most interesting. Once the overleveraged positions have been cleared, the market's open interest drops and funding rates normalize. The question becomes: who buys first?
Historically, Money Printer and Smart Money cohorts begin accumulating at lower prices within hours of a major liquidation event. Their behavior is countercyclical: they buy when smaller cohorts are being forced out. Leviathans and Whales tend to re-enter more gradually, often over days rather than hours, with lower leverage than their pre-event positions.
Meanwhile, Shrimp and Exit Liquidity cohorts often return quickly, but at disadvantageous prices. The behavioral pattern repeats: re-enter after the bottom, chase the recovery, over-leverage again. Tracking this rotation through cohort data provides a real-time view of market health that aggregate OI numbers simply cannot offer.
Why the September 2026 Hike Was a Cohort Data Event
Several factors made this particular rate decision especially interesting from a cohort perspective.
The market was already stressed. The CLARITY Act liquidations earlier in the week had already flushed a significant amount of leverage. By the time the FOMC announcement landed, a substantial portion of the most vulnerable positions had already been cleared. That context matters because it means the cohort behavior during this rate hike was cleaner than usual. The noise traders were already gone.
It was the first hike in three years. Markets had spent 2024 and 2025 in a cutting and holding regime. A rate hike is a fundamentally different signal, and trader segments respond differently depending on whether they've adapted their mental model to the new regime. Money Printers, with their track record of surviving multiple cycles, typically adjust faster than negatively-performing cohorts.
The dot plot signaled more to come. With 16 of 18 officials expecting further hikes, this isn't a one-time adjustment. Traders who assume "the hike is priced in" may be underestimating the cumulative impact of a tightening cycle on leveraged positions. The cohort data over the coming weeks will reveal which segments are adapting and which are repeating the same patterns.
What to Track in the Days Ahead
The rate decision happened yesterday. The real signal will emerge over the next one to two weeks as positioning data accumulates. Several metrics are worth monitoring through HyperTracker's API:
- Cohort bias shifts. Watch whether Smart Money and Money Printer cohorts maintain or increase their net exposure after the initial dip. A sustained long bias from profitable cohorts, even as rates rise, suggests they view the tightening as already priced into crypto.
- Leverage distribution by cohort. If smaller cohorts quickly return to high-leverage positions, it signals fragility. The next catalyst (whether it's the next FOMC meeting, CPI data, or an Iran escalation) could trigger another cascade.
- Open interest rebuild pace. Rapid OI recovery driven primarily by smaller cohorts is less healthy than gradual rebuilding led by larger, more profitable segments. The composition of the rebuild matters as much as its speed.
- Funding rate normalization. After a liquidation cascade, funding rates typically compress. If they stay suppressed for days while OI rebuilds, it suggests cautious positioning across the board. A quick snap back to elevated funding rates signals that leverage is returning faster than price stability.
- Liquidation risk scores. HyperTracker's liquidation risk endpoint shows which assets have the highest concentration of at-risk positions. After a macro event, the assets with the fastest leverage rebuild are the most vulnerable to the next shock.
Building Macro Awareness Into Your Trading Stack
Rate decisions are high-attention events, but they're not the only macro catalysts that move perp markets. CPI releases, employment data, oil price shocks, and regulatory announcements all create the same pattern: anticipation, volatility, cascade, recovery. The cohort data response follows the same structure every time, because human behavior under financial stress is remarkably consistent.
Builders working with our API can programmatically track these patterns. A few practical approaches:
- Pre-event monitoring. Pull cohort positioning data in the 48 hours before a scheduled macro event. Look for divergences between Smart Money and Exit Liquidity positioning. If they're aligned, the market has consensus. If they diverge, one side is going to be wrong.
- Liquidation cluster tracking. Use HyperTracker's liquidation risk endpoint to identify which assets and which cohort tiers have the highest concentration of at-risk positions. Those are the assets most likely to cascade.
- Post-event recovery signals. After the cascade, track which cohorts are accumulating. If Money Printers are buying while Shrimp are panic-selling, the recovery is likely underway. If all cohorts are de-risking simultaneously, the move may have further to go.
Our data refreshes every 5 minutes through HyperTracker's API, which means you can track these intra-day shifts as they happen, well before they show up in aggregate metrics or Twitter commentary.
Track Cohort Shifts After Every Macro Event
HyperTracker's API delivers positioning data across 16 behavioral cohorts on Hyperliquid, refreshed every 5 minutes. See which segments are accumulating, which are deleveraging, and where liquidation risk is building. Plans start at $179/mo.
The Bigger Picture: Rate Cycles and Perp Market Structure
The September 2026 hike is a reminder that perpetual futures markets don't operate in a macro vacuum. When the cost of capital increases, the calculus of leveraged trading changes. Funding rates on perps are influenced by the broader interest rate environment, because the opportunity cost of holding levered positions goes up when risk-free yields are climbing.
For Hyperliquid specifically, the platform's $240 billion in 30-day trading volume and over $14 billion in total open interest mean that macro events create measurable, analyzable dislocations. The volume is there. The open interest is there. And because everything happens on-chain, the data is transparent and queryable in ways that CEX data simply isn't.
That transparency is the foundation of cohort analytics. Every wallet's position is public. Every liquidation is recorded. Every shift in positioning by the Money Printer cohort or the Exit Liquidity cohort is observable by anyone with the right tools. Rate hikes don't just move prices. They reveal which traders were prepared and which ones weren't. Our data makes that distinction legible.
The next FOMC meeting is in November. The dot plot says more hikes are likely. The cohorts are already adjusting. The question is whether you're watching.